


Long before I started in IT, I wanted to teach. The process of learning something, then performing it, crafting it, learning from mistakes, further crafting it, and sharing that journey with others appealed to me as a great career. Rod Paddock (Editor-in-Chief for CODE Magazine) recently told me that the May/June 2024 issue of CODE would deal with databases. At the same time, I've been seeing many questions on LinkedIn that boil down to, “How do I increase my SQL/database skills to get a data analyst/database developer job?” In this industry, that question is complicated, as it means different things to different people. It's arrogant to claim to have all the answers, because doing so would presume that someone knows about every job requirement out there. Having said that, I've worked in this industry for decades, both as an employee and as a contractor. I'd like to share what skills have helped me get and keep a seat at the table.
Opening Remarks: A Rebirth of SQL Server Skills
Over the last few years, there have been intense opportunities and job growth in the general area of data analytics. That's fantastic! There's also been a reality check of something that database professionals warned about last decade: the need for those using self-service BI tools to have some basic SQL and data management skills. As part of research, I spent a substantial amount of time reading LinkedIn posts, and talking to recruiters and other developers about this, and there's one common theme: There's still a booming need for SQL and data handling skills. I want to make a joke about being an old-time SQL person and a “boomer,” but I was born one month after the official end of the boomer generation.
I'm a big sports and music fan and I often hear people talk about the “DNA” of great athletes and musicians. In this context, the definition isn't referring to the biological aspects of a person. It's more the traits they carry with them and the habits they've burned into themselves that they leverage regularly to do their jobs and do them well. I certainly hope that everyone who's willing to work hard will get a job, and I'm equally excited that I've seen a resurgence of “what SQL Server skills should a data person have?”
I know people who build great websites and great visualizations in reporting tools, where the available data was very clean and prepared by an existing data team. However, for every one individual job out there like that, there's more than one job where you'll have to put on your SQL/data-handling hat.
I've worn multiple hats in the sense that I've always had work. I make mistakes, I underestimate, I still commit many silly errors that we all, as developers, wish we could avoid. Although no one person can possibly cover every possible SQL/data skill that will make someone successful, I stepped back and thought, “What has helped me to help clients? What has been the difference-maker on a project?” And that's why I decided to write this article. This will be a two-part article. Throughout both, I'm going to mention some topics that I covered in prior CODE Magazine articles where the content is still just as relevant today.
You can find many web articles with titles like, “Here are the 30 best SQL Server interview questions you should be prepared for.” There are many good ones and I recommend reviewing them as much as you can. I also recommend getting your proverbial hands dirty inside of Microsoft SQL Server Management Studio. On that note, I'm using Microsoft SQL Server, which means I'll be covering some Microsoft-specific topics. Having said that, many of the topics in this article are relevant to other databases.
I didn't want to call this article “The 13 things you should study before a SQL interview,” because I'm going beyond that. I'm covering what I think makes for a good SQL/database developer. Yes, there's overlap, as I want to share some of the specific skills companies are often looking for.
First, Know Basic SQL
“Knowing basic SQL” is really two things: understanding the SQL language (according to the ANSI SQL standard) and understanding specific features in the database product (in this article, Microsoft SQL Server) and some of the physical characteristics of Microsoft databases. There are great books out there, but these topics tend to come up again and again. I'll start with some index basics, even before getting into some language basics.
Know the Different Types of Indexes
A common question is the difference between a clustered index and a non-clustered index. With this and other topics in this article, I'm not going to write out a full definition, because other websites have done a great job. But here are things I think you should know.
You can only create one clustered index per table and that index defines the sorted order of the table. For a sales table that might have millions of rows, a clustered index on either the sale transaction ID or possibly the sales date will help queries that need to scan over many rows in a particular order.
You can have many non-clustered indexes. They serve the purpose for more selective queries: that is, finding sales between two dates, finding sales for specific products, specific geographies, etc. A non-clustered index might contain just one column (composite index), or it could contain multiple columns if you'll frequently need to query on a combination of them.
Related: Know When SQL Server Will Use These Indexes:
Just because you create an index doesn't mean SQL Server automatically uses it. For instance, you might create indexes that SQL Server won't use, either because the SQL statement you're using isn't search argument optimizable or because you might not realize what something like compound indexes will (and won't) do.
I'm going to take the table Person.Person from the AdventureWorks database and create my own table. I'll also create two indexes: a clustered index on the primary key (BusinessEntityID) and a non-clustered index on the Last Name and the First Name.
drop table if exists dbo.TestPerson
go
select * into dbo.TestPerson from Person.Person
Now I'll use a single query to retrieve the row for a specific Business Entity ID:
select * from TestPerson where BusinessEntityID = 12563
In the absence of any index, SQL Server must perform a table scan against the table and read all 19,972 rows. Here's what SQL Server returns for an execution plan (Figure 1).
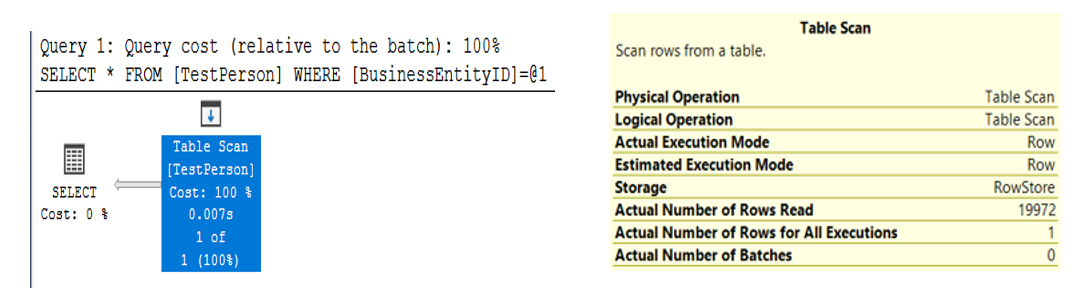
Although the query runs in a split second, SQL Server had to read through all the rows. It's not exactly optimal.
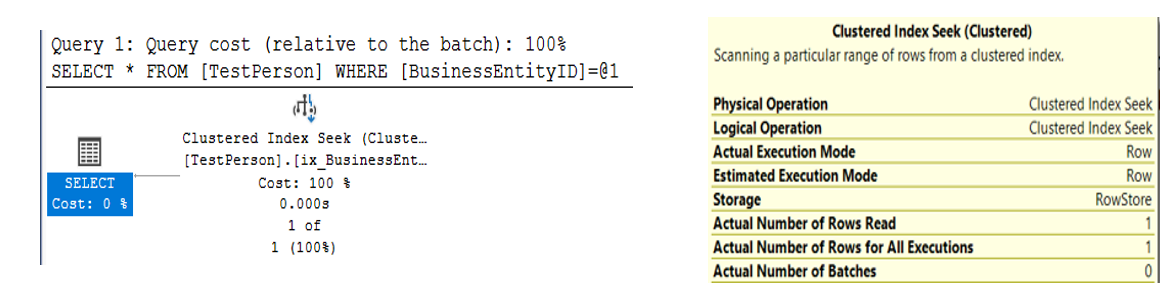
Now let's create a clustered index that drives the sort order of the table:
create clustered index
    [ix_BusinessEntityClustered] on TestPerson(BusinessEntityID)
If I run the same query again and then look at the execution, I'll see a very different story: a INDEX SEEKCLUSTERED INDEX SEEK where SQL Server only needed to read one row (Figure 2).
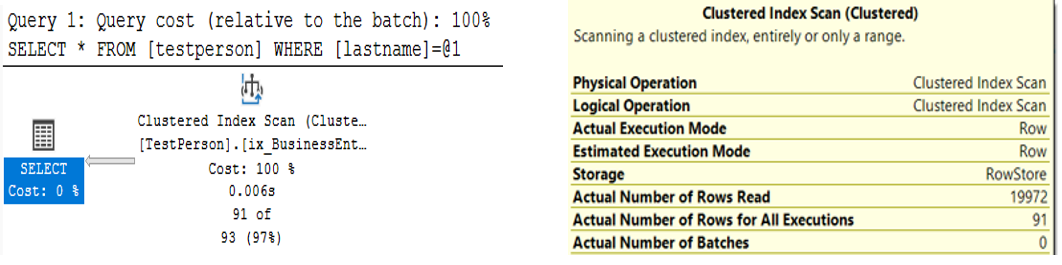
Next, I'll query the table for all names where the last name is “Richardson”.
select * from testperson where lastname = 'Richardson'
Does the clustered index help us at all? Unfortunately, not really. Although SQL Server scans a clustered index instead of a row table (heap), SQL Server must scan all 19,972 rows (Figure 3).
To help with queries based on a last name, I'll create a non-clustered index on the Last Name column.
create nonclustered index [ix_LastName] on TestPerson ( LastName)
After creating the index on Last Name, let's query for a specific last name, and then for a specific last name and first name:
select * from testperson
   where lastname = 'Richardson'
select * from testperson
   where lastname = 'Richardson' and firstname = 'Jeremy'
In the case of the first query, SQL Server uses a more efficient INDEX SEEK on the new index. However, it does need to perform what's called a KEY LOOKUP into the clustered index, to retrieve all the columns (because I did a SELECT * to ask for all the columns).
What happens when you query both a first and last name? You only retrieve one row, so the server does less work to return the results back to the application. However, under the hood, you'd see something different. Yes, SQL Server still performs an INDEX SEEK but must perform the filtering on the first name when it reads the 99 rows from the clustered index. In this case, the non-clustered index certainly helped to narrow the search, but SQL Server still needed to “scan” through the 99 rows to find all the instances of “Jeremy”.
Okay, so what happens if you create a composite index on the Last name and First name?
create nonclustered index [ix_LastNameFirstName]
  on TestPerson (LastName, FirstName)
If you run the query again to retrieve both the last name and the first name, SQL Server performs an INDEX SEEK and reads just one row into the Key Lookup to get all the columns for that single person. You're back in optimization heaven.
Okay, so a composite index further optimizes the query. Here's the last question: Suppose I query only on the first name to retrieve all the people named Jeremy? Will SQL Server use the FirstName column from the index and optimize as well as it did when I used the last name? Figure 4 doesn't give us great news.
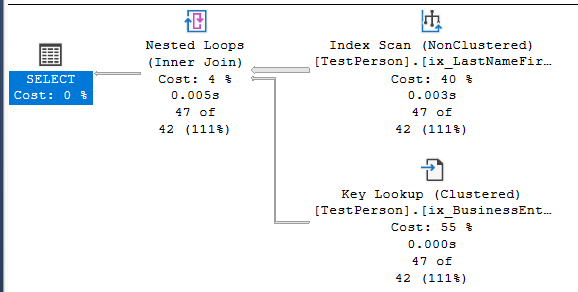
Unfortunately, SQL Server won't perform an INDEX SEEK. Although SQL Server uses the LastNameFirstName index, it performs an INDEX SCAN through all 19,992 rows. It only finds one “hit” and performs a key lookup to retrieve the non-key columns.
To achieve the same general optimization, you'd need to create a separate index where the leftmost column (or only column) is the first name. Bottom line: SQL Server reads the leftmost key columns, so keep that in mind when designing indexes, and query against multiple columns.
You can find many websites that talk about composite indexes. Here's a particularly good one: https://learn.microsoft.com/en-us/answers/questions/820442/sql-server-when-to-go-for-composite-non-cluster-in
Indexes and Fill Factors
Some developers who're very good at SQL queries hesitate to get involved with questions that get closer to what some might normally feel is “the job of a DBA.” As an applications developer, I'll freely admit that I don't have full knowledge of a DBA. However, there are some topics that cross over into the application space, and even if you don't use them, it's still important to at least understand why some tasks are not performing well.
As a basic introduction, when you create an index, you can define the percentage of space on each leaf-level index page that SQL Server fills with data. Anything less than 100% represents the remainder that SQL Server reserves for future index growth. If I specify 90% (often a default), SQL Server leaves 10% empty for instances when additional data is added to the table. Setting a value too high (or too low) in conjunction with index fragmentation can lead to “opportunities for improvement.”
And Now for Some Basic SQL Syntax
Many SQL interviews start with making sure the person knows the difference between an INNER JOIN, OUTER JOIN, FULL JOIN, etc. I'm going to go over some examples in a moment, even though there are many websites that cover this. Before I start, here's a little secret during SQL assessments: You can put a person's knowledge of JOIN types to the test by presenting them with a scenario along the lines of this:
“Suppose I have 100 customers in a customer master and 100,000 rows in a sales table. You can assume that every sale record is for a valid customer. In other words, there are no orphaned sales rows. If I do an INNER JOIN between the rows based on customer ID, how many rows should I expect to get? If I do a LEFT OUTER JOIN, how many rows should I expect to get?”
Yes, that's an interview question floating out there, I kid you not. The problem is, you don't know if the person is trying to see what other questions you might ask, or maybe the person is trying to see if the two numbers (100 and 100,000) will be distractors. Just like spelling bee contestants will ask, “Can you use the word in a sentence,” don't be afraid to ask questions about the nature of the tables/keys/row counts that might be relevant.
Want to be able to handle questions on different JOIN types? First, practice with a database. If you don't have one, take some of the data in the Microsoft SQL Server AdventureWorks database or the Contoso retail data. I'll use AdventureWorks for a few examples with INNER and OUTER JOIN.
Suppose I have a Vendor table with 104 vendors. I have a Sales table with thousands of sales rows. I have sales for some vendors but not all. Assume the following:
- We have a Vendor table with 104 rows.
- Every PurchaseOrderHeader Vendor ID is a valid value as a Business Entity ID in the Vendor table.
- Each TotalDue row in the OrderHeader table is a positive value (i.e., no negative numbers).
What can I say about the number of rows I'll get back from this query, which will generate one row for each Vendor with sales, and a summary of the Order dollars?
select Vend.Name, SUM(TotalDue) as VendorTotal
from Purchasing.Vendor as Vend
   join Purchasing.PurchaseOrderHeader AS POH
      on Vend.BusinessEntityID = POH.VendorID
   group by Vend.Name
   order by VendorTotal desc
If someone asks you how many specific rows you'll get back, there's no way to answer that. Yes, you'll get back one row for each vendor that had at least one sale. However, because you don't know exactly how many vendors DIDN'T have sales, the row count could be as low as 0 vendors or as high as 104 vendors. You're doing an INNER JOIN (i.e., basic JOIN) that gives you vendors who have sales, will return one row for each vendor (because you specified a GROUP BY), and provides the sum of the Order Dollars.
Okay, let's change the query to this:
select Vend.Name, SUM(TotalDue) as VendorTotal
from Purchasing.Vendor as Vend
   join Purchasing.PurchaseOrderHeader AS POH
       on Vend.BusinessEntityID = POH.VendorID
   where (OrderDate BETWEEN '1-1-2012' and '12-31-2012')
   group by Vend.Name
   order by VendorTotal desc
I'll ask the same question: What can you say about the number of rows you'll get back and the sum of the dollar amounts? All you can say is that it won't be MORE than the first query, because you've set a filter condition in the Where clause to only read the rows with an Order Date in 2012. If all the orders were in 2012 to begin with, I'd generally expect the numbers to be the same as the first query. If there were orders in other years, I'd expect either the count of vendors and/or the sum of the dollar amounts to be lower. Again, I can't predict the specific number of rows: All I can say is that it's somewhere between 0 and 104.
Okay, let's take the original query and turn it into a LEFT OUTER JOIN:
  select Vend.Name, SUM(TotalDue) as VendorTotal
  from Purchasing.Vendor as Vend
     left outer join Purchasing.PurchaseOrderHeader AS POH
        on Vend.BusinessEntityID = POH.VendorID
     group by Vend.Name
     order by VendorTotal desc
In this case, I can say with certainty (assuming no orphaned/invalid foreign keys) that SQL Server will return 104 rows. I can say that with confidence because I'm doing a LEFT OUTER JOIN. I'm telling SQL Server the following: Give me ALL the rows from the table to the left of the LEFT statement (the vendor table), and either sum the vendor dollars or just give me a NULL value if the vendor didn't have any sales. Given the conditions, I can say with high confidence that I'll get back 104 rows.
Now, I'm going to throw the proverbial “curveball.” Suppose I want all the vendors (all 104), regardless of whether they've had an order. This time, I want the dollar amount to only reflect the sales in 2012. Will this give me 104 rows?
 select Vend.Name, SUM(TotalDue) as VendorTotal
 from Purchasing.Vendor as Vend
     left outer join Purchasing.PurchaseOrderHeader AS POH
        on Vend.BusinessEntityID = POH.VendorID
     where (OrderDate BETWEEN '1-1-2012' and '12-31-2012')
     group by Vend.Name
     order by VendorTotal desc
Some might say, “Sure, I'll get 104 rows. The dollars could be lower because we're filtering on a year, but we'll still get 104 rows.” They might defend the answer of 104 rows, because I've specified a LEFT OUTER JOIN. As one of the Bob contractors said in Office Space, “Hold on a second there, professor.” You'll only get the vendors who have an order. (When I run it, I specifically get 79, but the purpose of this discussion is to demonstrate that I'm no longer guaranteed to get all of them).
Here's why. That WHERE clause works a little too well. Even with the LEFT OUTER JOIN, the WHERE clause restricts the number of rows. I've known developers who were surprised to learn this, and I've seen code in production that fell victim to this.
If your reply is, “Well, I didn't know that, but I'd never write it that way,” take a moment to realize that you might inherit code where someone didn't know, but DID write it that way.
How can you get all vendors (in this case, 104), AND only get the sales dollars for 2012 (or a NULL). You need to remove the WHERE from the main query. There are several ways. Some will localize the condition in the LEFT OUTER JOIN, or (my preference) use a subquery. Here are both solutions:
select Vend.Name, SUM(TotalDue) as VendorTotal
from Purchasing.Vendor as Vend
    left outer join Purchasing.PurchaseOrderHeader AS POH
        on Vend.BusinessEntityID = POH.VendorID
        and (OrderDate BETWEEN '1-1-2012' and '12-31-2012')
    group by Vend.Name
    order by VendorTotal desc

select Vend.Name, SUM(TotalDue) as VendorTotal
from Purchasing.Vendor as Vend
    left outer join (select VendorID, TotalDue from
        Purchasing.PurchaseOrderHeader
          where (OrderDate BETWEEN '1-1-2012' and '12-31-2012')) POH
    on Vend.BusinessEntityID = POH.VendorID
    group by Vend.Name
    order by VendorTotal desc
In Part 2 of this series, I'll talk more about CROSS JOIN and SELF-JOIN scenarios. Basically, you use CROSS JOIN when you want to create a Cartesian product of the table rows. For instance, say you have 45 employees in a sales table and a calendar table with 52 weeks, and you want to create 2,340 rows, one for each employee/week combination. You use a SELF-JOIN when you need to query a table back into itself (i.e., you query it as Table A, then join to the same table as Table B, usually because the single table has a relationship across columns). Again, I'll cover them more in Part 2, because I want to review the topic of recursion and common table expressions.
Do you know what a UNION does and know the difference between UNION and UNION ALL? Here's how I answer that question. Suppose you have three different tables (or three query results), with the same number of columns. You want to append all of them into one table. If you know for absolute certain that the three tables don't contain duplicated rows (across all the columns), or you don't care if you get duplicate rows, a UNION ALL will give all the rows from all three tables. If Table/Result A had 100 rows, B had 200 rows, and C had 300 rows, a UNION ALL guarantees a result of 600 rows.
If there's any risk of duplicated rows, you should perform a UNION. A UNION will perform a duplicate check based on all the columns (under the hood, SQL Server performs a SORT DISTINCT). This can be expensive for large sets of data with many columns but might be necessary. If someone presents the scenario of three tables with the row counts I described, and asked what a UNION (not a UNION ALL) will generate for a final result count, the answer depends on whether any of the rows are duplicated across the tables.
Do you know the difference between HAVING and WHERE? I know good developers who stumble on this question. Yes, a good developer will surely test out the difference and do the necessary research when writing a query that calls for a HAVING and figure it out through some trial and error. Although it might seem a bit unfair to expect a person to verbalize the answer to every question, the ability to express an answer is sometimes rooted in the amount of actual experience. (This is such an important distinction that I'll cover it a second time in the advanced SQL Server section.)
That's certainly not a full list of basic SQL Server topics, but these are items and nuances that I'd expect database developers to know. Before I move on to some advanced SQL Server topics, I want to stop and bring up a point: MOST technical interviews are performed by people who can listen to an answer and judge appropriately. If you can establish a conversational dynamic with an interviewer, you can usually tell if the other person is adept at assessing your responses. I say "most, because there's something that still occurs in this industry, and it personally infuriates me, and that's when a “tech screening” is being done by a person who's given a script. It happens. Sadly, there's no hotline you can call to report such intellectual laziness (and believe me, I can use stronger words). You can try to call it out in the interview process, but obviously you run the risk of ruining your chances. My only advice is to just answer the question as best you can.
Some Advanced SQL Server
Ask ten different SQL developers what constitutes “basic SQL” versus “advanced SQL,” and you'll get many different answers. Here's my two cents and it's probably controversial: Anything that a standard ORM or Entity Framework generates as SQL code for an OLTP application is usually basic SQL. Anything that a data framework can't generate (or doesn't do well, so much so, in fact, that it becomes a good training example of how NOT to write something) is advanced. Yes, that's my story and I'm sticking to it.
Anything dealing with JOIN statements on matching keys, WHERE clauses to filter, and basic aggregation (i.e., summing the sales dollars across millions of sales rows and aggregating to one row per Product Brand), all of that falls under basic SQL querying.
Most of the other language features are “non-basic.” Okay, I'll acknowledge that the difference between HAVING and WHERE takes less time than explaining the nuances (and shortcomings) of PIVOT because the former is generally an “either/or” and the latter has several parts to it. Still, the next ones are some advanced topics.
Know the difference between HAVING and WHERE. Here's the bottom line: You use HAVING to filter on aggregated amounts, and you use WHERE when you're directly referring to columns in a table. Suppose you're retrieving the customer ID and the Sum of Sales Dollars and grouping by the customer. In the query, you only want Customers with more than one million dollars in sales. You can use HAVING Sum (SalesDollars) > 1000000 after the GROUP BY statement.
Alternatively, you can sum the sales dollars by customer to a temporary result set or derived table. When you query from the temporary result set or derived table, you can use WHERE, because the resulting rows are already aggregated down to specific columns.
Know how the RANKing functions work. These particularly come in handy instead of trying to use TOP (N). For instance, if you want to get the top five selling products by state, the RANK functions are preferable to TOP (N). Also remember that there are three flavors of the general RANK functions: ROW_NUMBER(), RANK(), and DENSE_RANK(). The first doesn't account for ties, the second accounts for ties and leave gaps, and the third accounts for ties and close gaps. Recently I caught an interviewer trying to trick me into a TOP N response when the query in question called more for a RANK function.
Select * from (
  select PurchaseOrderID, EmployeeID, VendorID, ShipMethodID,
         OrderDate, TotalDue,
    rank() over (partition by shipmethodid order by TotalDue desc) as RankNum
from Purchasing.PurchaseOrderHeader) t
where RankNum <= 3
order by ShipMethodID, ranknum
Understand how CROSS APPLY and OUTER APPLY work. These have been somewhat controversial topics in the SQL Server World. Introduced in SQL Server 2005, they're great for patterns where you need to perform more gymnastics than a regular JOIN (such as accumulating, reading across - or dare I use a COBOL term - “Perform Varying”). In my last article (CODE Magazine, January/February 2024), I wrote that CROSS APPLY can be used to get cumulative results. (Additionally, Microsoft added optional clauses in SUM OVER for ROWS BOUND PRECEDING in SQL Server 2012). There can be a performance hit with any of these features, as they potentially need to process and aggregate many rows over many iterations. I typically use these for overnight reporting jobs or any instance where users accept that the results won't be instant.
Over the years, I've discovered that CROSS APPLY has some other interesting uses, such as using a CROSS APPLY as an alternative to UNPIVOT:
create table TestTable
    (SaleDate date, Division1Sales money,
     Division2Sales money,
     Division3Sales money)

  insert into testtable values
    ('1/1/2023',100,200,300),
    ('1/2/2023',200,300,400),
    ('1/3/2023',200,300,0)

SELECT SaleDate, Division, Sales
FROM testtable
   CROSS APPLY (
      VALUES ('Division1', Division1Sales),
             ('Division2', Division2Sales) ,
             ('Division3', Division3Sales))
        Temp (Division, Sales)
WHERE isnull (Sales, 0) <> 0
Know when subqueries are required. I talked about this in my last article (CODE Magazine January/February 2024), using the seemingly simple example of multiple aggregations and when a subquery is needed. Ultimately, almost every developer runs into this situation of aggregating across multiple one-to-many relationships, where the two (or more) child tables have no relation to each other beyond their common relationship with the parent.
Understand Triggers and Capturing changes. I've written about this in prior CODE articles (most recently, January/February 2024), so I don't want to repeat details. Most environments need (or require) solutions to track changes to data. Whether it's writing automated scripts for triggers (or just hand-coding triggers), or using Change Data Capture, or relying on some third-party tool, it's critical to know how to log changes and how to report on them.
It's 2024 and there's no excuse for not capturing an audit trail of database changes. You have Temporal tables (SQL Server 2016), Change Data capture (SQL Server 2008), and you still have triggers (from the early days)! Pick one, study it, and implement it.
How do you optimize queries? You have a query that suddenly runs slowly and you need to figure out why. Here's where there's seldom a single right answer. There are several diagnostic philosophies here. One of the things I'll do is to hit the low-hanging fruit first. Have there been new application deployments, did the volume of data spike astronomically overnight, can you run SQL Profiler or use the SQL Query store to get a bigger picture, etc. The list of the “low-hanging fruit” can be very long and five different people can contribute 10 uniquely valid ideas, but the point is to identify whether some significant event triggered the drop in performance.
Second, I'll review the query, the data, and the execution plan. Again, I might be looking for low-hanging fruit, but at least it's targeted toward the specific query. Over the years, I've become more cognizant that a solution using views (and views calling views) are not unlike blowing air into a balloon: At some point, you provide one more shot of air and the balloon pops. My point is that adding “one more table” or “one more join” to a view five distinct times doesn't mean that the progressive impact will be consistent for all five. This is something I want to devote to a future article, but for right now, keep an eye on solutions that have nested views. They sometimes can lead to “too much air got pushed into the balloon.” In Part 2 of this article, I'm going to talk more about this, and how certain execution operators in the execution plan can give you a clue that you have an issue.
If the problem is indeed “views gone wild,” what's the solution? Well, “it depends.” I'm not a big fan of views calling views calling views to begin with, and so I'll try to delve into the workflow of the desired query. If it's something that only needs to be produced one or two times a day, I'll wonder if a materialized snapshot table with a crafted stored procedure will do the trick. Alternatively, maybe the culprit is a stored procedure that has five queries in it, and maybe the third of the five is the one taking all the time. Ultimately, those who can deal with bad performance are the ones who have gone through it many times. Quite simply, this isn't an easy topic.
Isolation Levels, Snapshot Isolation Levels, and Read Uncommitted (“Dirty Reads”)
No one should judge a developer negatively for not knowing about a specific feature. I've known good SQL Server developers who were unaware of a feature, or perhaps got it backwards. Having said that, I'm going to go out on a limb and say that if there's one area of knowledge that can help you stand out as someone with good skills, it's Isolation Levels. Odds are (and I emphasize, “odds are”) that someone who can speak to Isolation Levels, read/write locks, and the SQL Server snapshot isolation level is likely to show a good command of other SQL Server fundamentals. I'd almost call this an intellectual “gateway” feature.
In SQL Server, there are five isolation levels: Read Uncommitted (dirty read), READ COMMMITTED (the default isolation level), Repeatable Read, Serializable, and the Snapshot Isolation Level (added in SQL Server 2005 and it comes in two flavors). I'm going to cover the first two (read uncommitted and READ COMMMITTED) and the last one (snapshots) in this article, and I'll cover Repeatable Read and Serializable in the next article.
Any time I've ever been asked to talk about isolation levels, I explain them in terms of “Task A” and “Task B.” Both tasks could be users running an option in an application, or one of them could be automated jobs, etc. If anyone ever wants to test your knowledge of isolation levels, I highly recommend talking in terms of a “Task A” and “Task B” scenario.
I'll start with the default, which is READ COMMMITTED. Let's say Task A initiates a transaction that updates thousands of rows into a table. While that transaction is underway, Task B tries to read some of those rows. Because the default isolation level is “READ COMMMITTED” in SQL Server, that means Task B will be locked from reading updates from Task A (or could possibly timeout) until Task A finishes. The specific reason is because Task A's update has a write lock on the rows, and that prevents Task B from attaining a shared lock to read the committed version of the rows. Task B needs to wait for Task A to finish and commit the transaction (or for Task A to rollback because of some error in Task A).
There can be problems here, and discussions are not without controversy. Task B might simply need to get an “approximation” of data. In other words, it doesn't matter much if Task A commits or rolls back; it's small in the grand scheme of what Task B wants to query. What Task B can do is set the isolation level to a read uncommitted (dirty read). The benefit is that Task B won't run a risk of timeout waiting for Task A to finish, and a dirty read is sometimes a bit faster than a normal READ COMMMITTED, because SQL Server isn't even attempting to put a shared lock on the rows.
Sounds great? Well, dirty reads bring some real risks, and here are three of them.
First, suppose task A's transaction is updating both a header table and two child detail tables. Task B performs a dirty read between the update of the header table and the child tables. Task B sees the new header row but doesn't yet see the related detail rows. In other words, Task B returns an incomplete picture of what Task A's transaction intended to write. That's not good!
Second, suppose Task A starts and updates one or more of the tables, but performs a rollback at the end (because of some post-validation error, etc.). Suppose Task B read the data using READ UNCOMMITTED just before the rollback. Task B will be returning data that never officially saw the light of day because Task A rolled it back. That's also not good!
These two alone should provide caution to developers who use READ UNCOMMITTED. Again, there can be specific instances (often tied to workflow throughout the course of the day) when dirty reads can help, provided those instances are well-managed. There's also a third risk. This one is covered less often in web articles because it's not very common, but it's still a risk. Suppose Task A's transaction is performing inserts such that a page split occurs in the SQL Server table. If Task B is using a dirty read, it's conceivable that Task B could pull back duplicate rows that came from the page splits.
Okay, so a READ COMMMITTED means that users might get timeout errors (or wait longer for the results of queries), and a dirty read means that avoiding those timeout situations might lead you to reading “bad/dirty” data. This was a challenge for a long time. Fortunately, Microsoft SQL Server 2005 addressed this with one of the more important features in the history of the database engine: the SNAPSHOT isolation level. (Notice how I've skipped past REPEATABLE READ and SERIALIZABLE. I'll cover them in Part 2 of this series).
Now I've gotten to the SNAPSHOT Isolation Level. I'm biased, but this is a fantastic feature. This comes in two flavors, the standard SNAPSHOT (that I call a static SNAPSHOT) and a READ COMMMITTED SNAPSHOT (that I refer to as a dynamic SNAPSHOT). This gives us the good benefits of dirty read and READ COMMMITTED but without the downsides.
First, to use the standard “static” snapshot, you need to enable it in the database, because SQL Server is going to use the TempDB database more heavily:
-- Code to alter a database to suppport static snapshots
ALTER DATABASE AdventureWorks2014 SET ALLOW_SNAPSHOT_ISOLATION ON
Here's the scenario for a static snapshot:
- Customer XYZ has a credit rating of “Fair”.
- Task A starts a transaction and updates the customer's credit rating to “Good”. This transaction could take several seconds or even minutes to complete if it's a long and intensive job
- You've seen that Task B will have to wait (or might even timeout) if you use the default READ COMMMITTED. You've also seen that Task B returns a value of “Good” if it uses a READ UNCOMMITTED, which isn't “good” if Task A rolls back.
- Suppose that Task B starts its own read session/read transaction and simply wants to get the last committed version (“Fair”). Task B can initiate a transaction, set the ISOLATION LEVEL to “SNAPSHOT”, and then query the table: Task B's query returns “Fair”. It won't give you a dirty read and it won't give you a timeout.
Sounds great, doesn't it? Overall, it is, although there's one downfall. Suppose Task A commits its transaction, but Task B is still in the middle of its READ session of SNAPSHOT. If Task B queries the row again (in the same read session), it continues to return “Fair” because it continues to read from the last committed version AT THE TIME its own READ session started. (This is why many DBAs refer to snapshot isolation as versioning).
Many DBAs refer to snapshot isolation as versioning.
Here's what Microsoft did to handle that. In my opinion, this ranks as one of the finest achievements in the history of the SQL Server Database engine. They added an optional clause to the SNAPSHOT isolation level. By performing the following setting, you are guaranteed that EVERY default READ COMMMITTED will give you the most recently committed version.
-- Code to alter a database to suppport READ COMMMITTED SNAPSHOT
-- This will configure SQL Server to read verions from TempDB

ALTER DATABASE AdventureWorks2014 set read_committed_snapshot on
Go back to the previous example. If Task B reads the row a second time, it picks up the change from Task A. Again, it's because of the dynamic nature of READ COMMMITTED SNAPSHOT.
You don't even need to start read sessions with a SNAPSHOT isolation. By turning on READ_COMMITTED_SNAPSHOT in the database, every single READ COMMMITTED (the default level) automatically pulls the most recently committed version of the row right at that time.
Does that mean that the READ COMMMITTED SNAPSHOT will work wonders right away? It might, but there's one catch. As SQL Server is using TempDB as a version store, DBAs will likely need to step in to deal with the management of TempDB.
Now for Something a Little Bit Different
Here are two more SQL Server tricks and approaches that experienced database developers have up their sleeves.
First, suppose you have a report that shows one row per product with the sum of sales. The company sells the product in different sizes, but the report only shows the summary of sizes.
Now suppose the business has an urgent request. At any one time, maybe two or three of the sizes need to be replenished (which you'd pull from a query). You want to show the list of sizes, except the report row granularity is fixed and you can't add additional row definitions to the report. Also, because there might be 20 sizes, you can't add 20 columns out to the right of the rest of the data, with a checkbox for the sizes you need to replenish because that would take up too much space.
But wait! There's something you can do. After talking to the users, they just need to know the X number of sizes, nothing else. It's almost like seeing a tooltip on a webpage, except this is a generated report. Maybe all you need to do is just add one more column to the report, called “Sizes to Replenish”, and show a comma-separated list of the sizes?
If you've ever read the famous Design Patterns book, you'll know that the authors (affectionately known as “The Gang Of Four”, Erich Gamma, Richard Helm, John Vlissides, and Ralph Johnson) came up with some great “short but sweet” names for patterns. Well, I'm not talented enough to come up with “short but sweet terms,” but I have a name for this pattern. I call it the “stuff the X number of variable business values into a single comma-separated list, and then jam that as a single new column in the report.” (Side note: I'd never succeed in product branding.)
I've had business users who were happy with this result, and IT managers who breathed a sigh of relief that there was a simple solution that wouldn't disturb the expected row count.
Okay, so how can you do this? Prior to SQL Server 2019, a common approach was to use the “FOR XML” statement. In SQL Server 2019, Microsoft added a new STRING_AGG function to read over a set of rows and “aggregate” values into a comma-separated string. Take a look at STRING_AGG, which works very nicely. Also, look at STRING_SPLIT, a long overdue feature to easily do the reverse: convert a comma-separates string of value into a result set.
Second, this is one that initially seems like a simple job for MAX and GROUP BY but winds up being a bit more involved. Because I've established myself as a long-winded branding author, I'd like to refer to this pattern as the “I thought I only needed a GROUP BY and MAX, but now I need to go back and pull one other column that's not directly part of the aggregation.” (I'd fail marketing.)
Suppose you have a query that initially shows the single highest transaction by customer. It could be something as simple as this:
SELECT CustomerID, Max(SaleAmount)
    From Sales
  GROUP BY CustomerID
But now you're asked to show the Sales Person associated with that sale. You can try all day long, but you won't be able to write this as a single query. You'll need a subquery of some type.
Additionally, you could have a tie within a customer. Maybe the customer bought something from Sales Person A for $100 and something else from Sales Person B for $100. There are two sales transactions for the same amount with a different Sales Person.
Here's another situation when spotting this pattern (and writing a correct query) can sometimes indicate a developer's level of experience.
;with tempcte as
   ( SELECT CustomerID, max(SaleAmount) as MaxSale
       from Sales Group by CustomerID)

Select tempcte.*,  OriginalTable.SalesPersonID,
OriginalTable.SaleID, OriginalTable.SaleDate
From Tempcte
  Join dbo.Sales OriginalTable
     on Tempcte.ID = OriginalTable.ID and
     tempcte.MaxSale = OriginalTable.Saleamount
There are multiple ways to write this. Some might use the Common Table Expression as an in-line subquery, and some might use CROSS APPLY, etc. This point is that when you aggregate across many rows to come up with a SUM or a MAX or whatever, you might need to bring along some additional columns for the ride. (Aha! Maybe I can call this the “Tag-along” aggregation pattern!)
Finally, I want to bring up a pattern that I've only had to deal with twice (to my recollection). It was a bit unusual, and very humbling. I had to write a query that summarized process duration, and mistakenly thought that a few subqueries and aggregations would do the trick. It turned into a hair-pulling afternoon, although I benefitted from it. I came up with a working solution, and then learned later that another SQL Server author (Itzik Ben-Gan) had documented the pattern, called “gaps and islands.” Because I already presented the code in a prior CODE Magazine article (January/February 2018), I'm not going to re-paste the code here. If you want to see a more advanced example of where a developer can mistakenly oversimplify a problem, I documented my entire thought process in the January/February 2018 issue of CODE Magazine ("A SQL Programming Puzzle: You Never Stop Learning").
Data Profiling: I've Seen Fire (Audits) and I've Seen Rain (More Audits)
I'll admit, I have a bit of a wise-guy side to me, and it nearly came out in a recent conversation. Someone asked if I'd done data profiling and the proverbial little devil on my left shoulder wanted to say, “Well, I don't know that specific term, but in my last project, I had to take a large number of rows from a bad OLTP system and search for patterns.”
Obviously, I didn't make that joke, but here's what I DID say: You can't spell “accountability” without “count.” To me, accountability isn't about “who can we blame if something goes wrong?” Accountability means “what can we count on” or, in the world of databases, “all rows are present and accounted for in some manner.”
For example, I worked on a project where we had some pretty significant cost discrepancies between two systems. We knew the issues stemmed from code between the two systems that needed to be refactored. Before we could dive into that, we had to come up with a plan RIGHT AWAY to fix the data. Of course, you can't fix a problem (or in this case, a myriad of problems) without identifying all the issues, and that was the first order of business: identifying all the different ways data had gone bad.
Without going into specifics, we found four different scenarios. Of those four, two of them had sub-scenarios. Some of these were simple and “low-hanging fruit” and some were more complicated. Here were some of them:
- Rows in the legacy system marked as deleted/archived, but still in the production system
- Rows in the legacy system marked as deleted, but should not have been
- Rows in the legacy system with multiple cost components, where the target system only ever recognized the first component
- Rows in the legacy system with cost values that the target system could not process (dirty data that had never been validated)
- Multiple rows in the target system that were marked as active, when only one row should have been marked as active, based on the granularity
Before I go on, I want to talk about that last word: granularity. It might sound pedantic to invoke that term during a meeting about fixing data, but as it turns out, three different functional areas in the company had different opinions about what constituted “granularity of an active row.” The problem is that some business users aren't going to think in the most precise terms about this (nor should they be expected to). They'll simply look at three candidate rows on a screen, point to the second, and say, “THAT ONE! That's the active row, and the others shouldn't be, because of this and this and this.”
And that, folks, is how you come one step closer to defining (in this case) what constitutes the definition of an active row.
Okay, back to the original story, one of the first things we provided to management was a summary of what percentage of bad rows fell into each category. We had roughly 6,000 rows identified as “bad” with 20% falling into Category A, 50% into Category B (and then a sub-breakdown of Category B), 10% into Category C, etc.
The queries were a series of COUNT and EXISTS
DECLARE @CategoryACount int , @CategoryBCount int

SET @CategoryACount = (select count(*) from CostDetailsLegacy outside
  where MarkedArchive = true
    And exists (select 1 from CostProduction inside
        where outside.<Key1> = inside.<Key1> and
              outside.<Key2> = inside.<Key2> and
              inside.ConditionForActive = true


SET @CategoryBCount = (select count(*) from CostDetailsLegacy outside
  where MarkedArchive = true
   And exists (select 1 from CostProduction inside
        where outside.<Key1> = inside.<Key1> And
              outside.<Key2> = inside.<Key2> and
              inside.ConditionForActive = true
Additionally, management might provide an error factor: Maybe if cost rates differ by less than two cents (rounding errors, bad math approaches involving integer division, etc.), and maybe they'll elect to tackle that later. Once I saw a manager flip out when they saw the top of the list of discrepancies sorted by variance and the overall row count. They thought that because the top 10 rows were off by a large percentage and we had thousands of rows, that we had a disaster. It turns out that after row 20, the variances dropped to pennies, with a slew of numbers off by just a small amount. So even within your categories, check the deviation among the rows.
I'm not going to devote two pages of code to the specifics (it'll just give me flashbacks and nightmares anyway). Hopefully you get the idea: You need to identify all the anomaly conditions before you can fix them. Additionally, management might decide to go over a particular scenario first, because it's the most egregious, or easiest to fix, etc.
Obviously, this won't fix any data, but it gives you a good structured starting point for a game plan, as opposed to playing the proverbial whack-a-mole when you see bad data. This is what I mean by data accountability: what rows you can “count on” as being valid, which ones you can't, and why. Trust me, the auditors are trained to think in these terms (and others).
Always Know the Product/Language Shortcomings
I was on an interview team where I asked a question that some liked and some wondered what planet I came from. It was for an ETL position where SSIS and T-SQL would be used heavily, and so I asked, “What three things about SSIS annoy you the most that you wish worked differently?”
I wasn't so much interested in the specific answers as much as I was interested in their though process and product experiences. At the risk of making an absolute statement, it's unlikely that someone has a strong amount of prior experience with SSIS and has been a happy camper about the product all the time. I love SSIS and I've debated with developers who refused to use it, but that doesn't mean I haven't (out of frustration) come up with alternate definitions for what the letters SSIS stand for! The SSIS Metadata manager in the data flow has gone from frustrating to barely acceptable over the years. SSIS's handling of package-level variables at the script level makes me think of two people talking with plastic cups and a string. I have other pet peeves. Again, I love SSIS, but the product has weak spots, and I'm curious to know what a developer thinks is a weak spot because it usually means they've cut their teeth with it.
When Microsoft first implemented the PIVOT in T-SQL 2005, I was mildly excited. I had done many queries involving aging brackets, and looked forward to converting some code I was writing to use PIVOT. The story's ending wasn't quite as happy as I expected. It streamlines some things, but also introduces other “gotchas” to be aware of (dynamic lists, multiple columns, and the need to PIVOT on one pre-filtered/pre-defined result set, as opposed to mixing PIVOT with other T-SQL constructs and with an irregular result sets). I was once asked in an interview what new language feature gave me the most frustration. I chose PIVOT: not because I didn't understand it, but because I'd had enough practical experience that I sometimes wondered if the pre-SQL Server 2005 approach was better. I'm reasonably confident that the interviewer would have accepted different answers, so long as I said something that demonstrated I'd gotten my hands dirty with it.
Normalization, Denormalization, and Warehousing Basics
There's a classic argument that goes along the lines of this: Person A will ask, “What's a short definition for X and Y, and what are the differences between X and Y?” Person B might very well have worked on projects involving X and Y, but might stumble on a definition, and finally respond, “Well, I can't give a textbook definition, but I've worked on both and know they're different, and I'm sure I can easily look them up on Google.” Person A might accept that when push comes to shove, Person B “probably” understands enough.
When developers face questions about the difference between normalization and denormalization and try to describe some common terms in data warehousing, they sometimes can fall a little short, even if they've successfully worked on projects. Yes, I realize that memorizing standard answers might not be the way to go, but….
Let's take normalization and denormalization first. The goal of normalized databases is to reduce/eliminate redundancy, to ensure data integrity, and to optimize getting data into the database as efficiently as possible. You might have to write queries to join data across many tables, but a SQL Server developer shouldn't fear that prospect. Typically, application developers are the only individuals who'll be accessing normalized tables with SQL code.
Denormalized databases are a different breed: Power users and “non-developers” might be more likely to read them because data can be redundant in denormalized tables. One of the major goals of denormalized databases is to optimize getting data OUT of the database as quickly as possible. Fewer complex JOIN statements are needed, which can appeal to power users who know how to use reporting tools but want to query the data with minimal effort.
Finally, something you can use to impress your friends at the dinner table: Some data warehouse initiatives (especially ones with a large number of disparate data sources) shape data into normalized structures FIRST as part of an overall ETL effort, before turning around and flattening them into denormalized structures. For developers who've only ever worked in one type of database, this concept might initially seem like overkill, but it's an invaluable approach for making sure data in the data warehouse is clean.
Yes, the capabilities of certain BI and reporting tools, and even advancements in database features, have created some grey areas, but these two concepts still breathe on their own today, and they're not going away.
The topic of data warehouses is a bit of a different story. There are developers who can cleanly describe the differences between normalized and denormalized databases but might admit to a shortfall of knowledge on data warehousing concepts.
If you plan to work in the data warehousing area, there's one book I absolutely recommend you read: “The Data Warehouse Toolkit: The Complete Guide to Dimensional Modeling” by Ralph Kimball and Margy Ross. There are multiple editions of this book. Even if you can only get access to the first edition, it's still worth reading. I realize that it almost sounds cultish to recommend a book so strongly, but the book actively engages in different business cases where Kimball and Ross use repeatable patterns to handle different scenarios. It's not just a book to quote, it's also a book with approaches to live by.
Next time someone says, “Why should I study the Kimball methodology? Isn't that antiquated?” here is a proper reply. “Do you think that all databases built on Kimball fundamentals have suddenly disappeared?” Knowing how to implement Kimball ideas will be relevant for a LONG time. It's not a technology, it's not a language: It's a collection of approaches, and an outstanding one that that.
There are many different data warehousing concepts, but here are a few you should know:
First, what are Fact Tables and Dimension Tables? Loosely speaking, Fact Tables represent activity/business processes. They could be sales, returns, transactions, manufacturing production and quality, or even survey evaluations: SOMETHING happened, and you want to analyze those somethings over time. They could occur five million times a day or just 100 times a week. Last night, I bought some new art supplies for my daughter - that transaction might very well be sitting in a fact table. More on that in a minute.
Dimension tables represent the business entities that are associated with the activity mentioned above. I bought the supplies at a certain time of the evening from a store in a particular sales district that belongs to a certain sales region. The products were specific art supplies made by a certain company and came in certain packaging.
Here's the single most important word in data warehousing: the word “by.” Sales departments want to see the rollup of sales dollars “by” city, “by” customer type, “by” date/month or even “by” time of day, “by” product manufacturer and product type. So those core identifiers that were part of the sale (the exact date/time, the customer ID, the product UPC, the store ID and maybe even sales register number) belong to larger groups.
If the product was a seasonal item, sales might want to track sales across years by season (seasonality), where the actual dates might vary a bit. (I like to use the classic example of tracking sales of fish foods during Lent each year, where Lent can be different weeks each year).
Now, you can look up fact tables and dimension tables and find several equally valid definitions. This is one of the reasons I detest unqualified people doing interviews with an answer sheet who are unable to determine if a particular response aligns with a predefined answer.
Okay, let's go back to fact tables. The scenario I described (a sales record) is the most common type of fact table: a transactional fact table. I can aggregate all the sales dollars (or aggregate by dimensional groupings) and that measure will mean something. You refer to the measures in a transactional fact table as fully additive.
Certain businesses want to take a picture of the sum of transactions over some period. Imagine a bank taking a picture of all a person's charges and all their deposits during the month and coming up with a balance. A company might, as part of a month ending process, read across all the bank transactions and write out a periodic snapshot table that holds the account ID, month ID, sum of charges, some of deposits, and the balance. Let's say they do that for three months and so the snapshot fact table holds three rows. Can you sum the numbers for the charges and deposits into something meaningful? In this case, yes. Can you sum the balance for each of the three months? Well, much as you might like that, the balance isn't cumulative. Unlike the first two measures, the balance isn't fully additive. Yes, you could take an average of it, which means that measure is semi-additive, and not cumulative. Periodic snapshot fact tables are not uncommon.
There's also a third type of fact table, usually involving an activity where you're not looking to sum up numbers (like sales or number of items produced) but merely counting the number of times something happened. For instance, let's say I teach two classes a day. Yesterday, 28 out of 30 attended Class A, and 18 out of 19 attended Class B. The next day, the numbers are 29 out of 30, and 17 out of 19, respectively. You might have a Factless fact table that records nothing more than the number of times something happened (attendance for a particular class by a particular instructor). All you really get out of the Factless fact table is the count, although that count over time (or average) might have analytic value.
Okay, I'm going to bring up one more topic that's likely to come up during an interview: slowly-changing dimensions. Here's how I describe it: suppose a product was introduced in 2022 and sold in all of 2022 for a manufacturer price of $50. On 1/1/2023, the price increased to $52. Then on 7/15/2023, the price increased to $53.
Here's the big question: Do you care about tracking sales during the time when the product was $50, versus $52, versus $53?
Here's another example. From the time I started paying taxes (i.e., age 18, first job), I've lived at 10 different addresses (kind of scary to think about it). Let's say some government agency tracks information about me. Do they care if was a resident in one area for X years/months and another area for a different amount of time?
When you care about aggregating fact data not only by an attribute (a product ID or a Social Security Number), but by changes to that attribute that have occurred over time, you refer to that as a Type 2 Slowly Changing Dimension.
Now you're wondering, “Okay, what's a Type 1 Slowly Changing Dimension?” It's simply when some attribute for an entity changes many times and there's no analytic need to aggregate fact data over time by each change.
There are challenges associated with Type 2 Slowly Changing Dimensions: late-arriving fact data and late-arriving dimensional changes. On the former, suppose you receive sales data today (late April 2024), but it represents transactions that occurred in January 2024. When you write out the fact data, you need to make sure the fact row points to the proper VERSION of that dimension at that time. On the latter (and this can be trickier): suppose you receive information today that a product's price changed back on 11/23/2023? You might be tempted to say, “Okay, we'll go back and update the dimensional pointers for those fact sales transactions that occurred after 11/23/2023 to point to the correct version of the product's change.” Well, that depends on the database policy regarding “updating” fact tables. In some environments, fact rows are INSERT ONLY - you CANNOT update a fact row. In this instance, you'd fix the X number of fact rows that would have been associated with the new version of the product change (had you received it in a timely manner), INSERT new rows with reversing sales amounts, and then INSERT the rows the way you would have in the first place. Yes, this happens!
And Speaking of Snapshots…
At some point, many businesses need to see what data looked like based on a point in time. This can take a variety of forms. Suppose you report on daily production every morning at 5AM. You might want to see what a product looked like between January 10 and January 11 (possibly because of some significant event). Here's another one: maybe you need to see what a customer profile looked like back on February 3. Finally, suppose you want to show the trend of inventory on the first day of the month, the last day of the month, and any monthly averages, over the course of a year.
If it sounds like I'm partly repeating myself (that is, I'm mentioning some of the scenarios from the data warehousing section), you're correct. Snapshot tables, audit trail tables, and slowly changing dimensions, they all have some overlap. Even if you don't work in a full-fledged data warehousing team, your ability to solve some of these challenges can increase your value. Some people have this impression of data warehouses as a bunch of old backup tapes from data 30 years ago that's kept offsite in some dusty storage area. I thought that way at the beginning of my career, and I could not have been more wrong.
Database professionals have different opinions about the structure of such tables. On the one extreme, some might simply use change data capture to log every single change, and then use queries to reconstruct history at any one point in time. Granted, that could be a lot of SQL code, but it can be done. Some create temporal tables (or use the temporal table feature added in SQL Server 2016) to possibly reduce the amount of code needed to reconstruct history. Some create periodic snapshot tables where the periods represent specific established business timelines (beginning of month, end of month, average during the month, etc.). On one occasion, a client was stunned that I was able to reconstruct a timeline to show some very irregular production history, believing that I'd somehow concocted a magic formula to suddenly show what happened on a day three months ago. It wasn't magic, it was basic data warehousing concepts. At risk of repetition, and at risk of our famed editor striking this sentence because it's overkill (smile), I can't stress enough the value of reading the Ralph Kimball methodologies in his data warehousing books.
Ever see those TV commercials where two people are debating about whether something happened the day before? Suddenly someone shows up with instant replay equipment to show what happened. You want to be the person who can show up with the necessary replay equipment.
Other Miscellaneous Things
Think globally: Your applications aren't the only ones that might touch the data you manage. When you're looking at audit trail requirements, you can't assume that your processes are the ONLY ONES that will touch data. Once I got into a spirited argument with a SQL Server author that I highly respected. In the argument, the author stated that the new OUTPUT INTO clause that Microsoft added to SQL Server 2005 meant that triggers and other audit trail features would go away. He defended his position by saying he'd never work for a company that didn't pipe ALL their insertions through stored procedures. I told him that it just wasn't practical to think that way, that other jobs might access and modify data.
In the database world, there are a few RED rules (rules you always follow) and lots of BLUE rules (rules you try to follow but might need to bend). At the end of the day, the pragmatists usually prevail - so long as they also have a plan for tomorrow and the next day.
Here's another topic: using PowerShell. I'll freely admit, I don't jump with joy when I use PowerShell. However, it can be an invaluable tool for “piecing together” different processes, especially database processes.
Suppose you need to run a standard ETL data job, execute some custom API out in the operating system, and then run a final database job? You'd like to use SQL Server Agent, as you could easily add steps 1 and 3 as job steps, and then place the PowerShell script in between the steps.
Here are some ways I've used PowerShell:
- To deploy reports to an SSRS or Power BI report server area under a different service account
- When I had a specific custom process where I needed to tap into ADO.NET in between job steps, and SSIS and .NET modules were not a deployment option.
Recommended Reading and Experimenting
There are many fantastic SQL authors out there, such as Itzik Ben-Gan, Greg Low, Brent Ozar. They have content on multiple websites. That's just three, and there are many other great ones as well.
I've written on SQL Server, T-SQL, and Data Warehousing concepts in many CODE Magazine articles. You can go to https://codemag.com/People/Bio/Kevin.Goff and see a listing of all my articles.
Here are ones I'd like to call out in particular:
- Two T-SQL articles
- A Power BI article:
- Four articles on SQL Server reporting Services:
I've created data projects and dashboard pages from personal data for everything from my weekly health stats to personal finances. The more you practice, the better!
It's great to read and absorb information from websites and books. Yes, sometimes it's because you're trying to solve a specific problem at work, so you already know you're getting your hands dirty and you just need to how to use your hands. Other times, you might be researching or learning a topic where you haven't gotten your hands dirty. All learning is kinetic in some way - a person could read a book on how to perform open heart surgery 100 times and be able to quote each line in the book, for instance. Well, I'm not saying that implementing a Type 2 changing dimension is open heart surgery, but the more you can demonstrate to others that you CAN do something…. As someone who's interviewed people, I might find someone's personal example (a good example) of implementing a Type 2 SCD, or someone being able to open two query windows with a test table to demonstrate READ COMMMITTED SNAPSHOT, to be very compelling.
One Thing I Won't Talk About (But One Final Thing That I Will)
There are other great tools and technologies that database developers use. One that comes to mind is Python. Database developers who also work on the .NET side will sometimes use Entity Framework. Those who work on the ETL side might use third-party tools such as COZYROC and possibly different Master Data Management tools. The list goes on and on.
I tried to focus more on core skills in this article. And trust me, a month after this issue is printed, I'll say to myself, “Rats, I forgot to mention some approach that could have made this article better.” For that reason, I'm splitting this article into multiple parts.
But here's something I do want to say. Those who follow sports might recall a player who was criticized for not giving full effort during practice sessions, and reacted during a press conference by repeatedly saying, “C'mon, we're talking about practice. Not a game, but practice.” Nearly all of us can think back to some time in our lives when we greatly improved our skills in some area. I'm betting that more focus and more practice and more studying played a role.
Reading SQL Server books and blogs is great, but what's even greater is taking some of those skills and trying them out on your own databases. Microsoft has AdventureWorks and Contoso Retail demo databases. When I wrote articles on COVID data, I found many Excel/CSV files with statistics. Yes, it took some work to assemble those into meaningful databases, but it was worth it. If you're starting out at a new job, or even applying for a new job, you want people to watch you do something and say, “Wow, that person has obviously done this before.”
Summary: What I Almost Called This Article
I've been working on this article for over four months. As most authors can attest, what you start with and what you finish with can be different things. As I look back over this, the content itself didn't change much, but the reasons I wrote it evolved. As I mentioned earlier, I've seen many LinkedIn questions where something like this would be helpful. I also wrote this because I wanted to share what things I've seen many times. I'll never claim to have all the answers on what makes a good database developer, but I've instructed people at a tech school whose mission was to help people get jobs (or get better jobs) and I've mentored other developers. I always wanted to take an inventory of what fundamentals I think others will find important, just to make sure I hadn't forgotten anything (and I'll freely admit that I'd forgotten the specifics of Fill Factor). I also know someone who's considering a career in this industry. I've been successful in my career: I've made many mistakes, and I've learned hard lessons as well! I wanted to look back on what areas of knowledge have helped me to be successful.
I've been talking to a developer that I mentored for a few years. Their first response was, “Wow, you're really trying to expose interviewers!!!” As Eric Idle said to John Cleese during the famous “Nudge Nudge Wink Wink” skit: “Oh no, no, no, (pause), YES!”
There are topics I covered in this article in more detail than others. I went into a fair amount of detail on the Snapshot Isolation Level, but only briefly talked about Change Data Capture and logging. There are other web articles out there, including some from me. As I've linked in this article, there were some topics that I've previously covered in CODE Magazine and didn't want to repeat.