


In 2002, I queried SQL Server data while developing with FoxPro and Crystal Reports. In 2006, I queried SQL Server data while developing with .NET and Crystal Reports. In 2015, I queried SQL Server data while developing with SSIS and SSRS. Today, I query SQL Server data while developing with many tools. As Mulder used to say on the X-Files, “Do you see a pattern emerging here, Scully?” I've worked with data for decades and I know a large majority of CODE readers can say the same. When you work with data, you see recurrent scenarios and sequences (patterns) that call for certain approaches. The database tool we use (in my case, usually SQL Server) provides different features in the T-SQL language to deal with those scenarios. You can use a feature optimally, you can use a feature that gets the job done (but might not be the most optimal), and you can accidently use the wrong feature, either because of lack of understanding of the feature, or lack of identifying the original pattern. SQL authors have devoted many articles and even books on SQL patterns, and here are my two cents on the topic.
Opening Remarks
Years ago, I worked with an individual whose background was very different from mine. We strongly disagreed on many topics. The conversations were never mean or nasty, but we had very different perspectives. Then one day I heard him say something I strongly agreed with: A common skill of successful professionals is the ability to identify patterns. I taught T-SQL for several years and continue to mentor developers on SQL programming, and I've always stressed the value of recognizing scenarios and how to tackle them.
I'll never know whether it's better to use a nine-iron or eight-iron on the golf course, I'll never know what's the best set of tools for building a bookshelf, and my family will attest that I don't know when a food recipe calls for certain ingredients - trust me on all of those! But I do know when certain data scenarios and query requirements call for specific uses. Yes, sometimes you can solve a situation with an ugly query that performs well or a more elegant solution that might have a slightly slower execution plan, and debate which is preferable. However, there are times when certain scenarios call for specific approaches (or at least strongly recommended approaches), while other approaches, although tempting, can lead to incorrect results.
There's no one magic formula to indicate if a person has strong skills in a certain area; however, I'll argue strongly that being able to identify scenarios (patterns) and knowing what solutions are appropriate is a major part of that formula.
When Subqueries Are Necessary
Just like ten different economists can give ten different interpretations of whether the country is doing well, ten different developers might just as easily come up with ten different solutions. That's fine, but it's also important to understand that some approaches are just not correct for certain data situations. For instance, in Figure 1, I show the results of three SQL Server tables: a Job Master File with one row per job, and then two child tables for Job Hours worked and Job Material purchases. You can see that two employees worked on two days for a total of 30 hours, and that someone purchased a tractor and cement for $3,000. (Yes, I agree, that's a very low price for a tractor. I'm just using it for demonstration purposes.) In a production environment, there could be thousands of jobs, each one with many Job Hour entries for hours worked and many Job Material entries for material purchases.
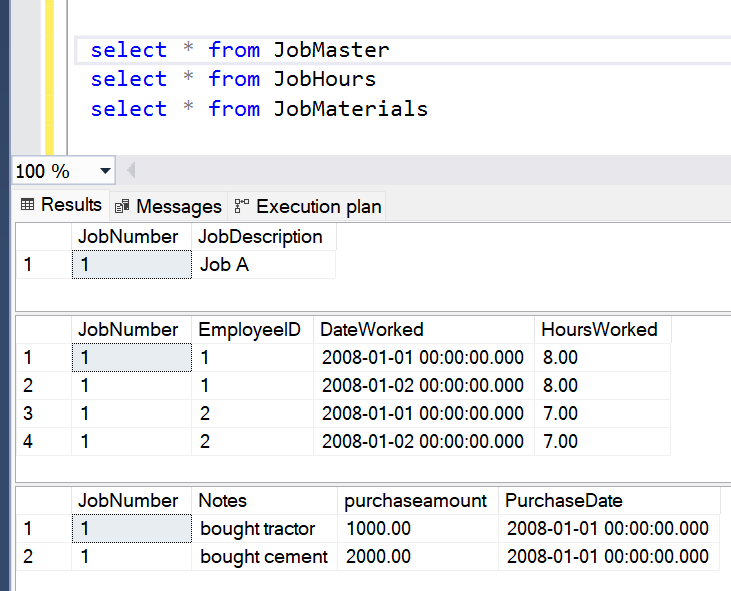
You need to write a SQL query that returns one row for each job, along with the sum of the hours worked and material purchases. Also, you need to consider that a new job might have labor but no purchase amounts, or purchase amounts but no labor. The two child tables are not directly related to each other beyond the fact that they both relate back to the same master table. When I taught SQL Server programming, after getting through the basics of joining tables and aggregating data, I offered the following code, and (borrowing from the Howie Mandel theme) asked my students, “Deal or no deal? Will this work?”
SELECT jobmaster.JobDescription,
     SUM(HoursWorked) AS 'SumofHours',
     SUM(purchaseamount) AS 'SumofMaterials'
     FROM JobMaster
         LEFT OUTER JOIN JobHours
             ON JobMaster.JobNumber = JobHours.JobNumber
         LEFT OUTER JOIN JobMaterials
             ON JobMaster.JobNumber = JobMaterials.JobNumber
     GROUP BY JobMaster.JobDescription
Understandably, some students would say, “Yes, it should work.” Well, let's see the results in Figure 2:
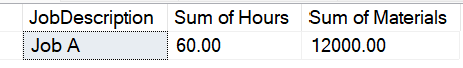
No one will ever mistake me for a math wizard, but those numbers seem higher than the results I expected. The results should be 30 hours and $3,000 in purchases. The sum of hours in Figure 2 is two times as much as expected, and the sum of purchases is four times as much as expected. Let's remember those two factors.
Is this a weird SQL Server bug or is this a trick question? Would you believe me if I said SQL Server was doing exactly what I told it to do? Before I get to the answer, here's a hint: Take the query and remove the aggregations and the GROUP expressions, like so:
SELECT Jobmaster.JobDescription,
       HoursWorked, DateWorked, EmployeeID,
       PurchaseAmount, PurchaseDate, Notes
FROM JobMaster
     LEFT OUTER JOIN JobHours ON JobMaster.JobNumber = JobHours.JobNumber
     LEFT OUTER JOIN JobMaterials ON JobMaster.JobNumber = JobMaterials.JobNumber
Figure 3 shows us the results. You see eight rows, even though there was only one job, plus four timesheets, and two purchases. Me thinks me spots an internal cross join! From Figure 2, the hours were twice as much and the purchases were four times as much: in other words, the number of time sheet rows (four) is the same as the factor by which it's high on the purchases, and the number of purchase rows (two) is the same factor by which it's high on the hours. This isn't a coincidence. The SQL Server engine joins each of the four instances of timesheets with each of the two instances of purchase amounts because there's no relationship between hours and purchase amounts (beyond their relationship to the parent).
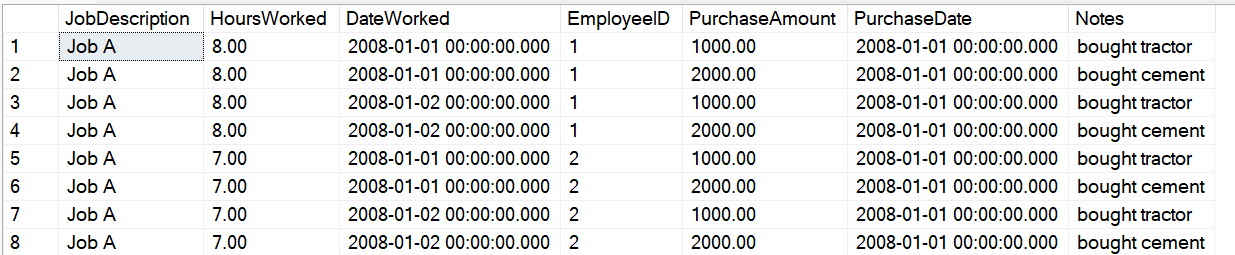
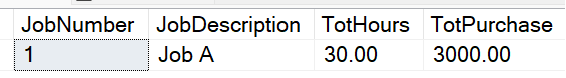
This is precisely the example I use to show the pattern that I call “multi-join aggregation,” where you CANNOT use a single SELECT with multiple join statements directly to the child tables. When SQL Server produces the final result set, it joins the result of the four timesheets with the result of the two purchase amounts and gives eight rows. You MUST use a subquery (or separate queries with temp tables, etc.) to aggregate the two child tables independently of each other, and then join those two aggregated child tables to the master parent table. This approach gives the correct results (Figure 4).
SELECT JobMaster.JobNumber,
       JobMaster.JobDescription,
       TotHours, TotPurchase
FROM JobMaster
   LEFT OUTER JOIN (
        SELECT JobNumber, SUM(HoursWorked) AS TotHours
        FROM JobHours GROUP BY JobNumber) HoursTemp
        ON JobMaster.JobNumber = HoursTemp.JobNumber
   LEFT OUTER JOIN (
        SELECT JOBNUMBER, SUM(PurchaseAmount) AS TotPurchase
        FROM JobMaterials
        GROUP BY JobNumber) MatTemp
        ON JobMaster.JobNumber = MatTemp.JobNumber
Moral of the story: When you have multiple one-to-many relationships, you want to aggregate data from multiple child tables, and the rows in the child tables have no relation to each other (except for the common parent row), you CANNOT use a single SELECT statement with multiple JOIN statements. At some point, you'll get an over-aggregation of data.
Logging Database Changes
There are at least three things in the world that drive me crazy: databases that don't track DML row changes, databases that don't track DML row changes, and databases that don't track DML row changes. Okay, other things bug me, but I grit my teeth when I see database environments that don't track row changes (but should). If I had a dime for every time I wanted to know what user changed a row value and when but couldn't, I'd be wealthy.
I'll qualify that: Not ALL databases need to track row changes. If you're rebuilding a report datastore or some type of data mart, you don't need to capture changes in the target database. Mainly, I'm referring to transactional OLTP database systems where users are entering/changing data frequently. In some industries, knowing who changed what and when is a requirement. Sadly, even then, I've seen some industries make exceptions because of legacy applications that were “grandfathered in.”
In SQL Server, there are at least three general options to track and log insertions, changes, and deletes: Triggers, Change Data Capture, and Temporal tables.
First, before SQL Server 2008, the “tried and true” method was DML database triggers. DML Triggers are events that fire on all INSERT, UPDATE, and DELETE statements. You can place custom code inside these trigger events to capture the before and after changes and log them to your own custom log tables.
Let's use the AdventureWorks PurchaseOrderHeader table as an example. There's a requirement to update the ModifiedDate ONLY when someone changes the freight and/or ship method. You also want to log the old value/new value to a log table. Prior to SQL Server 2008, the best approach was to put that logic in an UPDATE trigger.
Side note: Some developers would argue that the application layer should be responsible for this. I won't argue that point, but I will say that it can be a big leap of faith to think that the application is the ONLY operation that ever touches the table. External ETL jobs (especially legacy jobs) might need to touch it, or someone with database administration rights might load SQL Management Studio and manually modify the rows. These actions (and others) might fall outside the application layer. What you need is a process that fires EVERY TIME someone updates a row: That's where TRIGGERS, for all their challenges, are perfect.
Suppose you issue an UPDATE statement and update five rows but only three of the rows contained actual changes to the ship method/freight columns, and therefore you only care about those three. If you place code in the UPDATE trigger event of the table, SQL Server gives you access to two extremely critical system tables: INSERTED and DELETED. They come from the SQL Server transaction log and give you the “before values” and “after values” of the rows.
There are two parts to it. First, you want to tag the ModifiedDate with the current date and time, but only if the user changed either the Freight column or the Ship Date. Second, you want to log the before and after values to some log history table. Again, SQL Server makes two system tables available: INSERTED and DELETED. They will be structurally identical to the table for the trigger (PurchaseOrderHeader) and contains the state of the rows after the update (INSERTED) and before (DELETED). Note: The table must have a Primary Key definition (whether an identity column or some other primary unique definition) so that you can match up the rows you want to update in the original table, the INSERTED table (with the new values), and the DELETED table (with the old values). The following code tackles the challenge of only updating the ModifiedDate if you have an actual change:
UPDATE Purchasing.PurchaseOrderHeader
SET ModifiedDate = getdate()

FROM inserted INS
     JOIN Purchasing.PurchaseOrderHeader POH ON Ins.PurchaseOrderID = POH.PurchaseOrderID
     JOIN Deleted DEL ON Ins.PurchaseOrderID = Del.PurchaseOrderID
WHERE ins.Freight <> del.Freight OR ins.shipdate <> del.shipdate
Before moving on, I want to show something that I've seen in production environments to detect a change: Some people use the UPDATED function and the column in question. Will this work? It seems much simpler. All I can say is, yes, it catches any changes to Freight or ShipMethod ID, but potentially more rows than that.
UPDATE Purchasing.PurchaseOrderHeader
SET ModifiedDate = getdate()
WHERE UPDATED (Freight) OR UPDATED(ShipMethodID)
All the UPDATED function does is tell you if the original UPDATE statement (that fired the trigger) referenced the Freight/ShipMethodID column to begin with. Therefore, If I executed this code, the trigger would sense that I included either column (which would cause UPDATED to return a TRUE value) in the UPDATE statement, even though I did not change the values!
UPDATE Purchasing.PurchaseOrderHeader
SET ShipMethodID = ShipMethodID,  FREIGHT = Freight

-- the UPDATED function in the trigger will flag EVERY Row, because I specified
-- the two columns for Update, even though I didn't actually change values!
There's only one absolutely reliable way to detect which rows actually changed values, and that was the original example by lining up INSERTED and DELETED and comparing values. To do this, you need to make sure the table has a unique primary key, and you need to line up the INSERTED/DELETED rows (based on that key) and check the value of the column in the INSERTED/DELETED tables.
Okay, so that takes care of marking the last update column. Now for the second part: How do you write the changes to log table? By using the same approach:
INSERT into HistoryLog (TableName, PrimaryKey, ColumnName, OldValue, NewValue, DateTimeChanged, UserName)

SELECT 'Orders' as TableName, Ins.PurchaseOrderID as PrimaryKey, 'Freight' as ColumnName,
       Del.Freight as OldValue,  Inserted.Freight as NewValue,
       GETDATE() as DateTimeChanged,  SYSTEM_USER as UserName
FROM Inserted Ins
     JOIN Deleted DEL ON Ins.PurchaseOrderID = Del.PurchaseOrderID
WHERE Ins.Freight <> Del.Freight
At this point, you might ask, “Okay, that was for an UPDATE. What happens if I use an INSERT or DELETE?” In the case of an INSERT, the INSERTED table contains the inserted rows, and the DELETED table is empty. In the case of a DELETE, the reverse occurs. This can help you write specific code in the trigger to perform actions based solely on adding or deleting rows.
Two more side notes on triggers. First, when you query the core table and the INSERTED/DELETED tables, you must write the query as set-based: In other words, you need to assume that there could be multiple rows triggering the original UPDATE. To this day, I've seen UPDATE trigger code that tries to capture the concept of the “single key” and “single freight value being updated” into a scalar variable. Depending on how you populate that scalar value under that assumption, the trigger will either generate an error, or worse, only process the last row the trigger encountered. You must write triggers on the assumption that multiple rows are being impacted, which is essentially what is meant by set-based solutions.
Second, in SQL Server 2005, Microsoft allowed developers to reference INSERTED/DELETED directly in DML statements. That way, you could perform an UPDATE, tap into the new values/old values, and redirect them to a temporary table. Does this reduce the need for triggers, if you can log things directly “in-line” in a DML statement? I argue that it might not: It still relies on ALL actions performing the DML statements to play by the rules. Even application environments that claim to be locked down such that all DML activities are funneled through source code that's audited and placed under version control, even those that still make exceptions like those I described earlier (external legacy ETL, etc.). Again, for years, the trigger was the most foolproof method for capturing changes.
The bottom line is that triggers work and are extremely reliable. However, they're not perfect:
- If you're updating many tables/rows in an overall database transaction, the transaction won't complete until both the DML statements and the trigger code complete. It's important to write trigger code that won't bog down the overall transaction.
- If you have many tables and many columns you want to log, does that mean you have to write specific triggers for all the tables? The answer is yes. SQL Server is not an object-oriented database, so there is no native means to define generic logic that applies to an entire class of tables, nor can you dictate that tables will participate in an interface contract. Having said that, some companies have used third-party tools (or built their own) that generate trigger code through a data dictionary. This can be particularly helpful if you've implemented core trigger logic that you spread in your tool across 100+ tables, and then decide to make a change. The only challenge is factoring in that someone might append custom logic to a few of the triggers. For that, you'd need a basic hook pattern. Yes, it's doable and some have done it, but it does require a good up-front design.
Now that you've looked at triggers, let's move on and look at Change Data Capture. In 2008, Microsoft added a significant feature to the Enterprise Edition of SQL Server: Change Data Capture (CDC). As a basic introduction, CDC performs much of what database triggers perform when it comes to logging changes, with far less code. CDC works by setting up SQL Server Agent jobs that scan the database transaction log asynchronously for DML changes.
I want to stop for a moment. You MUST run SQL Server Agent. For the proverbial 98-99% of SQL shops out there that rely on SQL Server agent for database/ETL/report jobs, that's not an issue. However, I've seen environments (typically large database environments with certain regulations) that explicitly dictate using task scheduling tools other than SQL Agent. I won't debate the decision or try to justify why. Just know that if you don't use SQL Server Agent (or you aren't using SQL Server Enterprise Edition), you CANNOT use SQL Server Change Data Capture.
I wrote about CDC back in the September/October 2010 issue of CODE Magazine (as part of an article on SQL Server Integration Services). Here's a quick overview of the necessary steps:
- You MUST use SQL Server Agent and make sure Agent is running.
- Enable Change Data Capture for the current database, using the system stored procedure
sys.sp_cdc_enable_db. - Enable Change Data Capture for specific tables (and even specific columns if you don't want log all of them), using the system stored procedure
sys.sp_cdc_enable_table.
The following code shows how you can execute these procedures to enable CDC for a database and then a table.
-- enable Change Data Capture on Current database
exec sys.sp_cdc_enable_db

-- enable Change Data Capture for specific tables
exec sys.sp_cdc_enable_table
    @source_schema = 'dbo',
    @source_name = 'TestEmployees',
    @role_name = 'cdc_TestEmployees'
     -- , @COLUMN_LIST = '

-- After adding and changing rows, view the
-- Change tracking table that SQL Server
-- created
select * from [cdc].[dbo_TestEmployees_CT]
At that point, SQL Server creates change tracking tables (TestEmployees_CT) to “mirror” the original table. Suppose I create a table and I turn on CDC for that table (and all columns by default). Then I do the following:
- I insert rows A, B, and C, so I'll want to know what those rows looked like in Change Tracking History when I inserted them.
- Then I update Row A, so I'll want to know what row A looked like in Change Tracking History before and after the update.
- Then I update Row B twice, so I'll want to know what Row B looked like BOTH TIMES in Change Tracking History, before and after the update.
- Then I delete Row C. I'll want to know what Row C looked like in Change Tracking History before the update.
After I add those three rows, update row A, update row B twice, and then delete row C, SQL Server writes out ten rows to the Change Tracking table, as follows:
- The state of the row for each of the three insertions (three rows)
- The before and after states when I modified row A (two rows)
- The before and after states when I modified row B the first time (two rows)
- The before and after states when I modified row B the second time (two rows)
- The state of the row right before I deleted row C (one row)
Initially, this sounds fantastic, almost too good to be true! For the most part, it's that good. I'll even add that the CDC tracking tables also store signatures for any transactions that were firing, which might help greatly in debugging tricky transaction anomalies. However, there are a few things to be aware of:
- I mentioned that one of the downsides of triggers is that the code can slow down the overall transaction. CDC won't do this, as it scans the transaction log asynchronously (after the original UPDATE). On the one hand, that's great. It has little, if any, impact on the original transaction. However, there can be a lag before the data shows in the CDC tracking tables. Sometimes it might be a second (or less) or a few seconds, and you might say, “Who cares?” Other times ,if the job is updating a large number of rows, there might be a more noticeable latency of populating the CDC Tracking tables.
- For all the things that CDC captures, there's one thing it doesn't capture out of the box: the user who made the change. That's partly because CDC is scanning the transaction log after the transaction, so you'd need to meet it halfway by providing the current user when you update the rows. How can you grab that? Well, you could do it in the application layer, depending on how the application and database scope users. How else could you grab it? Ironically, one way would be to write a short update trigger!
Change Data Capture can capture many things but it can't directly capture the user who made the change.
In summary, I like Change Data Capture and have been part of several database environments that used it. For those who've never tried triggers, CDC offers great advantages for a built-in logging solution. Those who'd been using triggers had mixed reactions to CDC. Some chose to switch to it, and some chose to keep their trigger solutions. Although I still use triggers for clients that don't have SQL Server Enterprise, I do favor CDC when possible.
Okay, now let's take a look at the third option. In SQL Server 2016, Microsoft implemented temporal databases. Some jokingly (and non-disparagingly) referred to temporal databases as CDC Lite, as it provided some of the end results of Change Data Capture without the requirement of SQL Server Enterprise Edition. I wrote about temporal tables in the September/October 2016 issue of CODE Magazine. As the name implies, temporal tables store changes to values over time. To do so, there are three general requirements:
- The table must have a primary key.
- You must add two system columns to mark the Start and End Date for the lifecycle of the row.
- You must specify SYSTEM_VERSIONING and provide the name of a history table.
The following code shows an example of creating a SQL Server table with the temporal (version history) feature enabled:
CREATE TABLE dbo.ProductMaster
   (
        ProductID INT IDENTITY NOT NULL
                    CONSTRAINT PK_ProductID
                    PRIMARY KEY NONCLUSTERED,
        -- remainder of columns
        SysStart DATETIME2(0) GENERATED
                 ALWAYS AS ROW START NOT NULL,
        SysEnd DATETIME2(0) GENERATED
                 ALWAYS AS ROW END NOT NULL,
        PERIOD FOR SYSTEM_TIME (sysstart, sysend)
   )
   WITH ( SYSTEM_VERSIONING = ON
     ( HISTORY_TABLE = dbo.ProductMasterHistory));
There's seldom a good excuse for a transactional database application not logging data. It's like insurance. Much of the time you pay for it and don't need it, but when you need it, you need it.
NULLs Versus Empty Values
Some database systems have individual fields that contain both null values and empty values. The business process argument is that a NULL can mean something different from a blank value. At a minimum, this means that some report developers might want to transform the values for output clarity (they might need to transform a NULL into something like N/A). In other applications, this might be necessary. For instance, SQL Server Analysis Services balks when you try to process an OLAP dimension where an attribute contains both blank and NULL values.
This might sound like a near nit-picking tip, but it's only due to a few tools (SSAS being one of them) that have difficulty dealing with both blank values and NULL values, so you need to transform them into something different, such as this code:
SELECT CASE WHEN ISNULL(JobDescription,'') = ''
                THEN '**N/A**'
                   ELSE JobDescription END
            from JobMaster
Gaps and Islands Redux
On a Saturday afternoon in the fall of 2017, I sat down to write what I thought would be a simple query. You can guess where this is going! The afternoon was more like a tricky journey where I'd stumbled on a pattern I never truly encountered until that day. I came up with a somewhat kludgy solution, and then discovered afterwards that other SQL authors (such as the great Itzik Ben-Gan (https://www.linkedin.com/in/itzikbengan/) had identified this pattern and came up with arguably more elegant solutions.
The pattern I encountered that day was called “gaps and islands.” It's a real-life business process scenario with a range of sequence values, breaks in sequences, and gaps/missing values. Islands are essentially unbroken sequences, delimited by gaps. My example is one that falls under the gaps and islands pattern, where a traditional MIN/MAX/COUNT/GROUP BY won't suffice. The pattern uses different combinations of the LAG/LEAD and ROW_NUMBER functions across different groups/partitions. Sometimes it can be difficult to truly absorb the application of the pattern until you face an actual example with your company's data, and that's what happened to me that day.
After I came up with a solution, I realized that would be a great topic for an article. I won't waste time repeating the content of the article, you can read it in the January/February 2018 issue of CODE Magazine. If you're trying to do aggregations across sequenced values, with breaks and gaps where the traditional aggregation functions won't do, you might want to check out the article.
A Primer on Execution Plans
Let's take the Adventureworks database Purchasing.PurchaseOrderDetail. You want to write a query that aggregates Freight by Ship Method for a specific Period of time. You're allowed to create a non-clustered index that optimizes the query as much as possible. You then write the query two different ways: the first uses the YEAR function to filter on the year 2014, and the second filters on a specific date range.
You execute the two queries and each seems to run in less than a second. You conclude that the first query is probably better because the WHERE clause seems to be a bit cleaner. But is it the best approach?
create index [ix_Orderdate] on
   Purchasing.PurchaseOrderHeader
       (OrderDate) include (shipMethodID, freight)
-- Query 1
select ShipMethodID, sum(Freight) from [Purchasing].[PurchaseOrderHeader]
    where year(OrderDate) = 2014
    group by ShipMethodID

-- Query 2
select ShipMethodID, sum(Freight) from [Purchasing].[PurchaseOrderHeader]
    where orderDate >= '2014-01-01'
       and orderdate < '2015-01-01'
    group by ShipMethodID
Let's look at the two execution plans in Figure 5 and Figure 6 (I promise, execution plans won't bite!). You can see the first query performing an Index Scan, and initially, it reads all 4012 rows, even though I asked only for the rows for 2014. You can see the second query performing an index seek, and it initially reads 2,425 rows. Why did the first query need to read all the rows? Why didn't it focus on just the 2,425 rows the way the second query did? Here's the reason: You specified a function in the WHERE clause of the query. SQL Server needs to evaluate the results of the function for every row before it can determine if the resulting value is 2014. In other words, SQL Server cannot optimize this query to SEEK into the rows that match, because it needs to evaluate every row. By contrast, SQL Server can directly optimize the second query because you've referred directly to the OrderDate field (and not a function that needs to evaluate OrderDate).
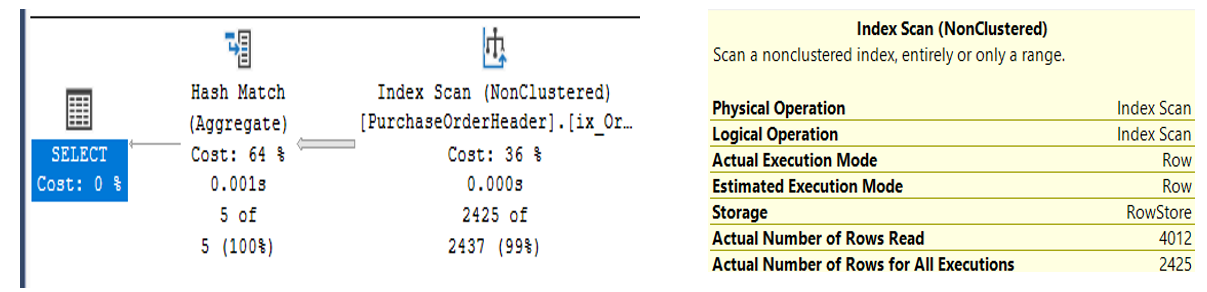
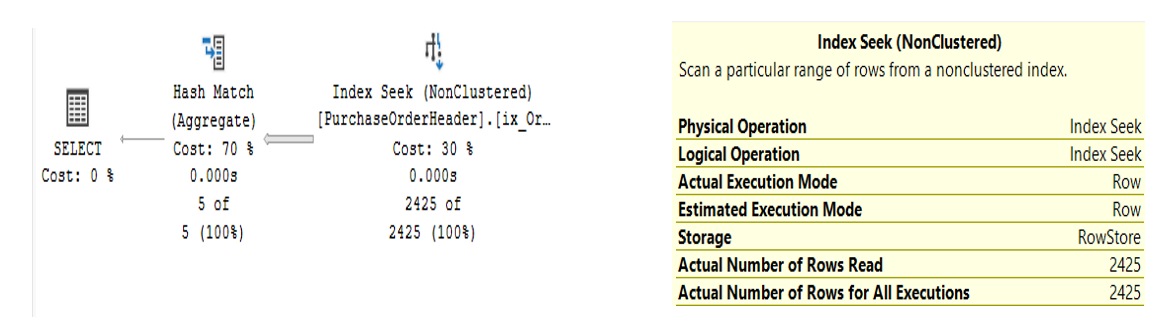
As a general rule, you want to be careful about using functions in the WHERE clause that reference columns for which you have an index: SQL Server won't be able to directly SEEK into the targeted values you want, and therefore drops down to an INDEX SCAN, which reads more rows. In this situation, the difference in execution of the two queries is negligible because this isn't a large table. But imagine if you had a table with millions of rows and a query that ran possibly hundreds or thousands of times a day. Would you want it doing a SEEK on just the rows that are going to be relevant to begin with or would you want it doing a SCAN on all the rows?
The Holy Grail of Creating Comma-Separated Values: STRING_AGG
Many times, I've needed to collapse a set of row values into a single comma-separated string. For instance, in Figure 7, I'm looking at two orders from AdventureWorks, order ID 7 and 8. The first has three products and the second has two.
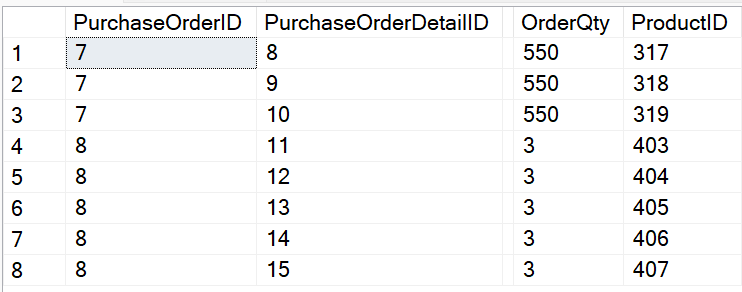
I'd like to create a comma-separated string like the one in Figure 8.
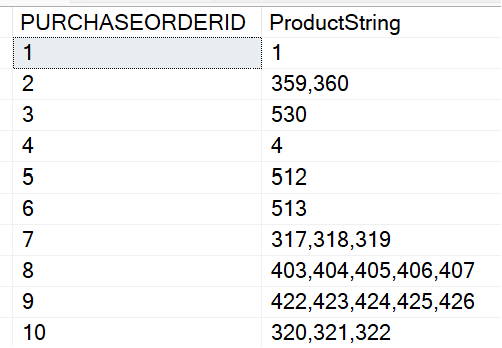
In the past, developers used FOR XML and other approaches to generate a comma-separated string. Fortunately, Microsoft added a nice function in SQL Server 2019 that makes this much simpler: STRING_AGG.
SELECT PURCHASEORDERID,
   STRING_AGG( CAST(PRODUCTID AS VARCHAR(10)),',')
   FROM PURCHASING.PURCHASEoRDERDETAIL
   GROUP BY PURCHASEORDERID
Two for One: When You Must Use HAVING and When to Use COUNT DISTINCT
Here's a pattern I've encountered several times with client databases where I need to get a count of multiple instances with a twist. In Figure 9, you'll see a list of orders. One order can contain multiple products. Each Product has a single discount that can be applied. Here's the question: You want to see a list of orders that have multiple discount types. You don't care if an order has multiple products, you only care if the order has multiple discount types.
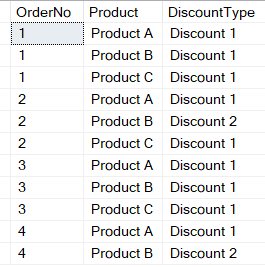
From time to time, I've seen developers using combinations of COUNT, WHERE, and HAVING that either generated an error or produced incorrect results. What makes this a little different is that you want to filter on the count of unique Discount Type values. You can see in the list in Figure 9 here that you want Order 2 and Order 4 in the results. How can you write this?
In my first few years with SQL Server, I'd do this with a subquery: The inner query performed a DISTINCT on the DiscountType and the outer query counted the number of Distinct Values from that inner query, like so:
   SELECT OrderNo, COUNT(*) AS NumUniqueDiscounts
       FROM (
           SELECT DISTINCT OrderNo, DiscountType
               FROM OrderData ) temp
             GROUP BY OrderNo
                 HAVING  COUNT (*)  > 1
That certainly works. Another approach is to combine the two using COUNT (DISTINCT).
SELECT OrderNo,
       COUNT (DISTINCT DiscountType)
   AS NumUniqueDiscounts
FROM OrderData
GROUP BY OrderNo
HAVING
   COUNT (DISTINCT DiscountType)  > 1
In either case, note the use of HAVING. You're using it to filter on the aggregation. Occasionally I've seen developers get tripped up on the difference between WHERE and HAVING. They are not inter-changeable: You use WHERE to evaluate a single row value and HAVING to filter on an aggregation, such as COUNT, COUNT (DISTINCT), AVG, SUM, etc.
Not knowing the difference between WHERE and HAVING means you might wind up writing a more complicated query than necessary. You use WHERE to look at single row values, and HAVING to filter on an aggregation.
When You Need to Do a CUMULATIVE Sum
Using the AdventureWorks PurchaseOrderHeader database, you want to know the Vendors in 2012 who had at least $100,000 in sales. Additionally, you want to know the specific order that put the vendor over $100K for the year. If a Vendor had two orders for $45K and then a third for $11K, you want to see the cumulative sum ($101K) as well as the Order ID for the order that put the vendor over $100K (in this instance, the third order).
Depending on what you've encountered in your career, you might recognize the pattern. You need to calculate a cumulative sum. Then you have the question of how to calculate this in SQL Server, and here's where opinions vary, particularly for application developers who've written a lot of C#/VB.NET code (or other languages). It's very tempting to write something that uses a row-by-row approach. In SQL Server, that often involves using cursors or some kind of looping construct. You can do it, and some developers do, but that type of approach is often very resource-intensive, especially if the query runs against a large set of data many times a day. I'm not going to say that SQL Server offers a magic bullet whose execution plan contains an optimal execution plan of SEEK, because it won't. However, there are two approaches you can take when you need to accumulate data based on some condition.
Starting in SQL Server 2005, Microsoft introduced the CROSS APPLY statement. When you've been raised on INNER and OUTER JOIN statements, CROSS APPLY can seem a bit difficult to grasp. As someone who actually wrote a bit of COBOL code in the 1980s, I sometimes compare CROSS APPLY to the COBOL Perform Varying statement. For each outer row (the list of vendors whom you know sold $100K in 2012 to begin with), you query the order amounts for that vendor in 2012 in Purchase Order ID order (the assumption being that Order IDs are sequentially assigned), creating a sum for all order IDs less than or equal to each outside order. Sometimes I call this a “soft-seek” (again, my own personal terminology).
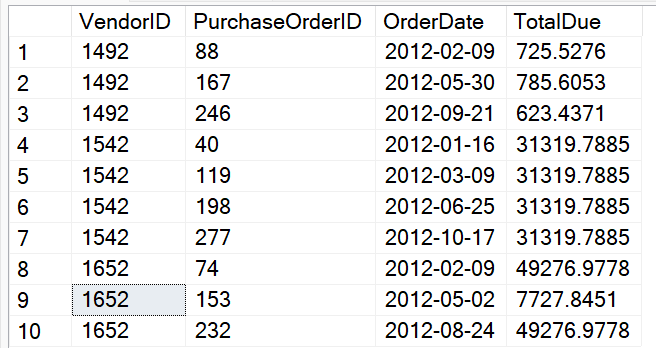
Let's start with the following code, that generates the results in Figure 10. I've listed the 2012 orders for three different vendors, in chronological order. Based on the goal of finding the first order by vendor that reached the $100K cumulative mark for the year, you can see that Vendor 1492 didn't make it, and the fourth order and the third order made it for Vendors 1542 and 1652, respectively.
select POH.VendorID, POH.PurchaseOrderID ,
   cast(POH.OrderDate as date) as OrderDate,
      POH.TotalDue
  FROM Purchasing.PurchaseOrderHeader  POH
   WHERE OrderDate BETWEEN
         '1-1-2012' and '12-31-2012'
     AND VendorID in (1492,1542,1652)
    ORDER BY
         POH.VendorID, POH.PurchaseOrderID
Using the “beginning with the end in mind” approach, here's the target result set in Figure 11. This's something you might generate manually to use as a test target.
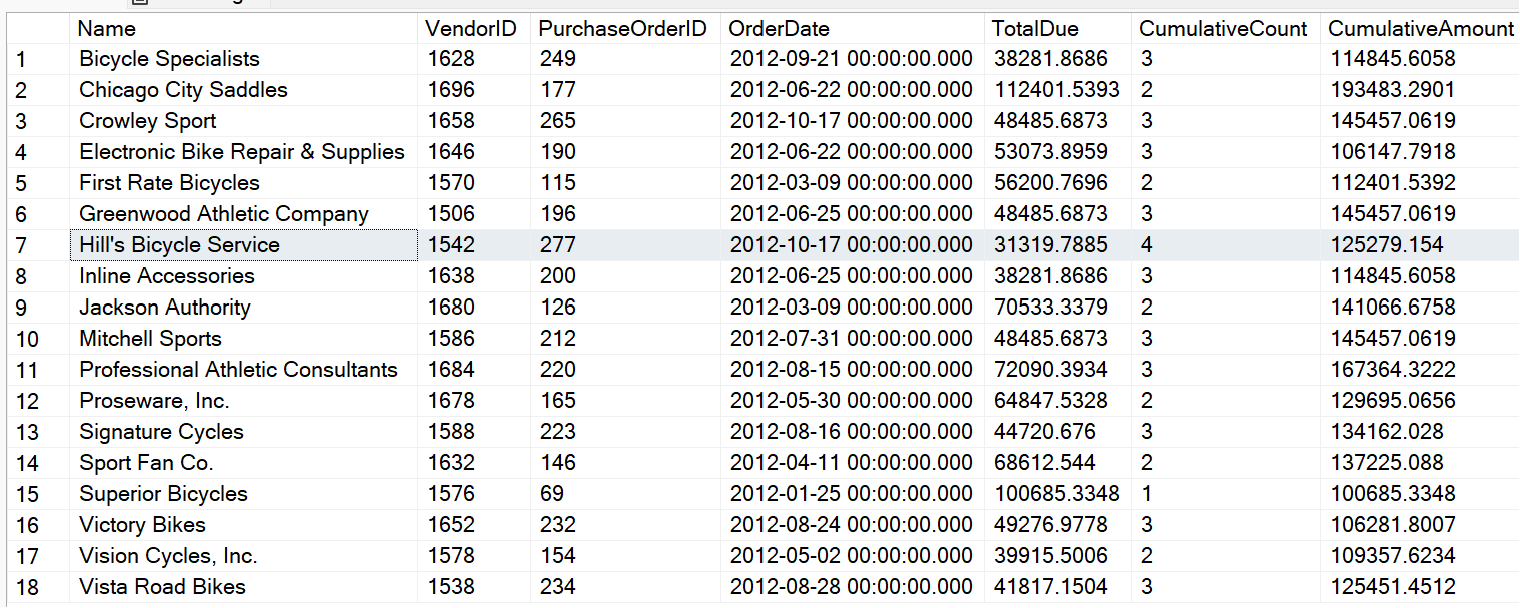
Going from the basic raw data in Figure 10 to the results in Figure 11 isn't a simple task. Many years ago, I might have said, “Just use SSRS or some other reporting tool, it does a great job of generating this kind of output.” Although that's true, I've also found myself in situations where such tools weren't an option, and all I had at my disposal was a SQL statement/stored procedure. Yes, sometimes we're like Tom Hanks in the movie Castaway, and all we have are the raw element on the island and a volleyball.
Here's what you can do to implement a cumulative result set. First, you need to identify a chronological element within Vendor Orders. In this database, the order date is a date, and not a datetime, and there could be multiple orders per day. Assume that you can rely on the sequential nature of the Purchase Order ID for chronology. So that means that for each vendor/order, you could step out and sum all the purchase order amounts for that vendor in 2012 that are less than or equal to the current order back in the first list. This is one pattern where you can use the SQL Server CROSS APPLY: Essentially, you're querying the PO Table (the main table) on the outside, and piecing it together with a correlated subquery (using CROSS APPLY) to read inside the PO Table again, but just for the rows for that vendor with a purchase Order ID less than or equal to the one out the outside. In concept, it's doing the following:
select ColumnsFromMainTable.*,
   ColumnsFromCrossApplyTable.*
FROM  MainTable  Outside
  CROSS APPLY (SELECT
    SUM(TotalDue) AS Cumulative,
    COUNT(*) as NumRows
       FROM MainTable Inside
         WHERE Inside.VendorID = Outside.VendorID
                AND  Inside.SomeKey <=
                 Outside.SomeKey ) ApplyTable
ORDER BY Columns
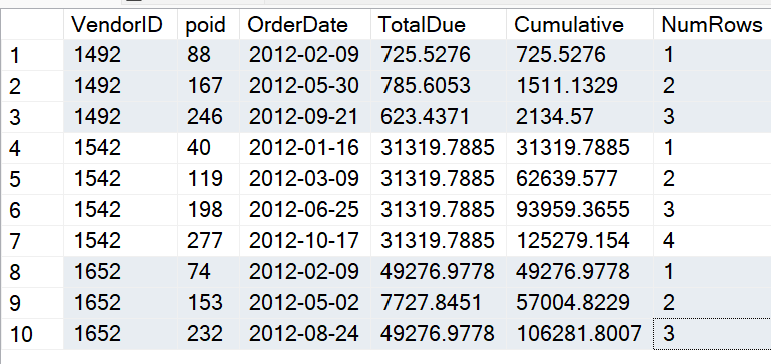
The actual query, right here, gives the results in Figure 12:
select POH.VendorID, POH.PurchaseOrderID AS POID,
   cast(POH.OrderDate as date) as OrderDate,
   POH.TotalDue,RT.Cumulative, RT.NumRows
FROM Purchasing.PurchaseOrderHeader POH
  CROSS APPLY (SELECT SUM(TotalDue) AS Cumulative,
               COUNT (*) as NumRows
               FROM Purchasing.PurchaseOrderHeader Inside
               WHERE Inside.VendorID = POH.VendorID
                AND  Inside.PurchaseOrderID <=
                       POH.PurchaseOrderID
                  AND OrderDate BETWEEN
                     '1-1-2012' and '12-31-2012') RT
WHERE OrderDate BETWEEN '1-1-2012' AND '12-31-2012' AND VendorID
    IN (1492,1542,1652) ORDER BY VendorID, POID
Okay, now that you've established a way to determine the cumulative sum, you can filter on that cumulative sum being greater than or equal to $100K and write an outer query that retrieves only the first record you find (you don't care about subsequent orders after you've reached the $100K mark). Listing 1 shows the full solution.
Listing 1: Full solution for a Cumulative Sum
;with CumulativeCTE as
  (
  select POH.VendorID, POH.PurchaseOrderID ,
      cast(POH.OrderDate as date) as OrderDate,
       POH.TotalDue, RunningTotal.Cumulative, NumRows
   from Purchasing.PurchaseOrderHeader POH
       cross apply (
         select sum(TotalDue) as Cumulative, count(*) as NumRows
           from Purchasing.PurchaseOrderHeader Inside
             where Inside.VendorID =poh.VendorID and
               Inside.PurchaseOrderID <= POH.PurchaseOrderID
                  and OrderDate BETWEEN
                   '1-1-2012' AND '12-31-2012'
        ) RunningTotal
    where OrderDate BETWEEN '1-1-2012' AND '12-31-2012'
            and Cumulative > 100000
    )

 SELECT Vendor.Name, Outside.*
 FROM Purchasing.Vendor
   JOIN CumulativeCTE Outside
       ON Vendor.BusinessEntityID = Outside.VendorID
       WHERE Outside.PurchaseOrderID = (
         SELECT TOP 1 PurchaseOrderID FROM CumulativeCTE Inside
         WHERE Inside.VendorID = Outside.VendorID
         ORDER BY Inside.PurchaseOrderID)
order by Name
Perhaps, on my website, I'll talk a little further about the execution plan for this query (and for the alternate approach I'm about to show). The execution plan and IO Statistics aren't going to make it into the SQL Optimization Hall of Fame: SQL Server creates an internal work table and performs multiple index spools. It's still likely to perform better than any looping construct/cursor solution.
I mentioned that Microsoft implemented CROSS APPLY in SQL Server 2005, although to this day, some still view it as a nascent feature. Well, Microsoft added a new feature in SQL Server 2012 that reduces the amount of code you need to write by leveraging the existing window function.
Listing 2 shows an alternate approach using COUNT /SUM OVER, and allows you to encapsulate the function of the correlated subquery (for the outer Vendor ID and for all Purchase Order IDs less than or equal to the current ID) by specifying the Vendor ID in the Partition, defining the order/sequence as the Purchase Order ID, and using ROWS UNBOUNDED PRECEDING to tell SQL Server that you want all rows on or before the current outer row, based on the order.
Listing 2: Another approach to Cumulative Sums, using ROWS PRECEDING
;with CumulativeCTE AS
 (select VendorID, PurchaseOrderID, OrderDate, TotalDue,
     count(*) OVER (PARTITION BY VendorID
                     ORDER BY PurchaseOrderID
                     ROWS UNBOUNDED PRECEDING) AS CumulativeCount,
     SUM(TotalDue) OVER (PARTITION BY VendorID
                     ORDER BY PurchaseOrderID
                     ROWS UNBOUNDED PRECEDING) AS CumulativeAmount
 from Purchasing.PurchaseOrderHeader
 WHERE OrderDate BETWEEN '1-1-2012' AND '12-31-2012' )

 SELECT Vendor.Name, Outside.*
 FROM Purchasing.Vendor JOIN CumulativeCTE Outside
      ON Vendor.BusinessEntityID = Outside.VendorID
        WHERE Outside.PurchaseOrderID =
         (SELECT TOP 1 PurchaseOrderID FROM CumulativeCTE Inside
           WHERE Inside.VendorID = Outside.VendorID
            Inside.CumulativeAmount > 100000
             ORDER BY Inside.PurchaseOrderID)
order by Vendor.Name
Although I like this approach in terms of simplicity, it's a tad more expensive in terms of resources than CROSS APPLY. SQL Server still creates a work table and performs an internal sort that adds to the execution time. As with many scenarios, YMMV (your mileage may vary) in your own environment, so it's best to test for any big differences.
Helping to Avoid the Pain of PIVOT
Microsoft implemented the PIVOT statement in SQL Server 2005. The primary usage pattern is when you have sets of rows that you wish to aggregate into specific columns. As a basic example, suppose you're retrieving sales data by date, and you want to aggregate the sales as quarterly column. Let's look at a simple example. The rows in Figure 13 show sales rows by customer, sales date, and ship method.
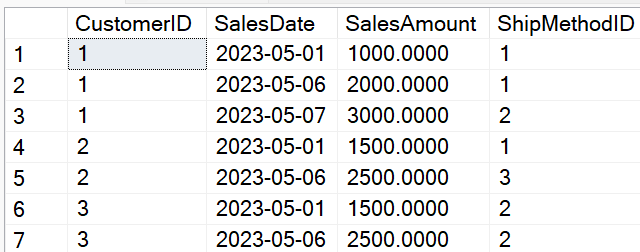
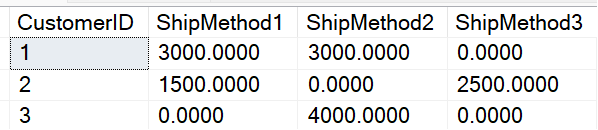
You want to generate a result set of one row per customer, with aggregated columns for the three ship method IDs (Figure 14)
SELECT CustomerID,
       [1] as ShipMethod1,
       [2] as ShipMethod2,
       [3] as ShipMethod3
FROM  PivotTemp
PIVOT  (SUM (SalesAmount) FOR ShipMethodID in ([1],[2],[3]) ) t
order BY CustomerID
Unfortunately, that code snippet doesn't give you what you wanted in Figure 14. Instead, it gives you this (Figure 15).
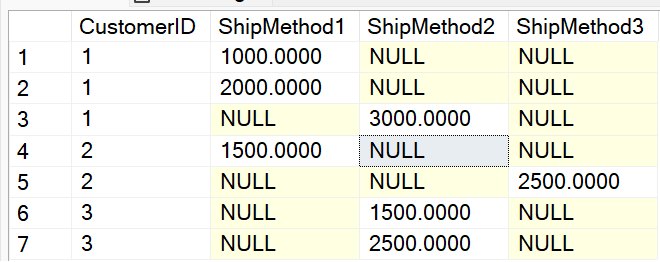
At this point, some developers get frustrated and wonder why they didn't get three rows, because you only asked for the Customer ID and told PIVOT to sum the SalesAmount for the three shipping methods. So why are you still getting all seven rows? Yes, the answer is “correct,” although you'd need to do an additional query to group by Customer ID. Wasn't the original query supposed to do that for you?
When I taught SQL, I'd use this as yet another example where SQL Server did what you told it to do, not what you wanted it to do. When you specified the entire table in the FROM statement, SQL Server is trying to create a PIVOT on all the columns, not merely the ones you specified in the SELECT. To avoid this, it's best to give SQL Server only the core columns in a derived table that you'll pass on to PIVOT like this:
select CustomerID,
      isnull([1],0) as ShipMethod1,
      isnull([2],0) as ShipMethod2,
      isnull( [3],0) as ShipMethod3
   FROM
      (SELECT CustomerID, SalesAmount, ShipMethodID FROM PivotTemp)  r
   PIVOT (SUM(SalesAmount)
      FOR ShipMethodID in ([1],[2],[3]) ) t
ORDER BY CustomerID
When you use PIVOT, know these two things: You must explicitly specify the spreading element values (or generate the code with Dynamic SQL), and you're strongly advised to whittle down the data you want to PIVOT into one table/derived table that contains ONLY the data you want. If you're performing the PIVOT on the direct result of multiple JOINs that bring back extra columns, reduce that final derived result into the bare minimum you need.
“You Spin Me ROUND”
All IT professionals love to tell stories about strange quirks/errors they encounter in systems they have to debug. One of my favorites (although at times it was nothing to joke about) is reporting applications that round the rows of a report, and then SUM against the rounded values. Depending on how the rounding goes and even the distribution of data, your final SUM could be off by pennies or even dollars.
Take, for example, the following query, which produces 12 rows.
;WITH tempcte AS
    (SELECT POH.PurchaseOrderID,
     round(SUM(OrderQty * UnitPrice),0) AS TotalDue
     FROM Purchasing.PurchaseOrderHeader POH
       JOIN Purchasing.PurchaseOrderDetail POD
         ON POH.PurchaseOrderID = POD.PurchaseOrderID
           where EmployeeID = 261
         GROUP BY POH.PurchaseOrderID)

-- SUM the rounded total
SELECT SUM(ROUND(TotalDue,0)) AS TotalDue
     FROM TEMPCTE
The query inside the common table expression returns 401 orders for the employee ID of 261, with an order amount that's rounded to the nearest whole dollar. If you sum the result of that CTE, you get $6,551,641.00.
However, if you avoid rounding the rounded results (the next query), you get $6,551,647.00. Yes, that's only six dollars, and (hopefully) no one is going to get written up for six dollars. But that's the type of “face validity issue” that can cause financial users, in particular, to wonder if the application is always handling aggregations correctly.
   SELECT round( SUM(OrderQty * UnitPrice),0)
      AS TotalDue
      FROM Purchasing.PurchaseOrderHeader POH
          JOIN Purchasing.PurchaseOrderDetail POD
           ON POH.PurchaseOrderID = POD.PurchaseOrderID
                  where EmployeeID = 261
When a query result is off by an expected number, context matters. I highly doubt that someone got out of bed and decided, “I'm going to round a bunch of numbers and then sum the rounded versions.” Still, especially when you're doing maintenance development, you might accidentally fall into the trap. This is why I seriously try to do an insane amount of data/aggregation verification.
Closing Remarks
I've covered different data handling scenarios and presented some recommendations, as well as some “don't do this” suggestions. I minimize using the words “best practice” because I know the word “best” is a very big word. However, I never hesitate to point out an approach that doesn't work or at least is risky. So yes, even our creative souls always need some discipline. I'll never pass up an opportunity to quote a movie, and two of my favorites come to mind (ones I've mentioned in prior CODE articles).
“Discipline is not the enemy of enthusiasm.” Morgan Freeman said that, playing the role of Educator Joe Clark in the film “Stand by Me.” I don't have to agree with every one of his actions to still agree with how much this statement resonates in any long-term success. Yes, taking the extra time to test results and to research can seem draining, but it's also a pathway toward creating a better solution, and that's something you can wrap your mind around.
The second movie is “Glory Road,” one of my favorite films. It's based on the story of college basketball coach Donny Haskins, who coached the Texas Western Miners (now known as UTEP, University of Texas, El Paso). Even if you don't like sports, you might still enjoy this movie. In the story, Haskins' players are very athletic but need some mentoring on basketball fundamentals. His approach works until one game when the Miners are losing badly. During a timeout, his players shout to the coach, “Coach, your way isn't working today, we feel too restrained, we need to be ourselves.” Haskins looks at the team and says, “Okay, fine. Your play your way - AND you play my way.” Haskins didn't say another word, he knew his players had to figure it out. If I had one piece of advice for younger developers, that would be it. It takes a blend of discipline and passion/creativity to have any long-term success.