


Growing popularity of AJAX has led to increased use of JavaScript in creating dynamic and rich browser experiences.
JavaScript has become the lingua franca of the Web and its performance has become an emerging differentiator in how the industry compares browsers. These attempts have so far been centered on the use of JavaScript micro-benchmarks. While this is a good first step, it is not sufficient in measuring end-user perceivable performance of AJAX applications. We used a more holistic methodology for measuring AJAX performance in Internet Explorer?8 Beta 2.
The AJAX Subsystems
In AJAX applications, data is retrieved asynchronously using the XMLHttpRequest object. An AJAX scenario can be visualized as an activity passing through a pipeline of logical subsystems within the browser stack. In order to understand the performance characteristics of AJAX applications, we need to understand what each of these subsystems do and how they interact with each other. Figure 1 shows the AJAX subsystems for Internet Explorer?8 Beta 2:
?Some of the tests we have done show pure JScript performance improvements up to 2.5 times. Key gains are in strings. We also measured the performance gains on common Gmail operations, like loading the inbox (24%), opening a conversation (35%) and opening a thread (25%) compared to IE7" - Greg Badros, Senior Director of Engineering, Google
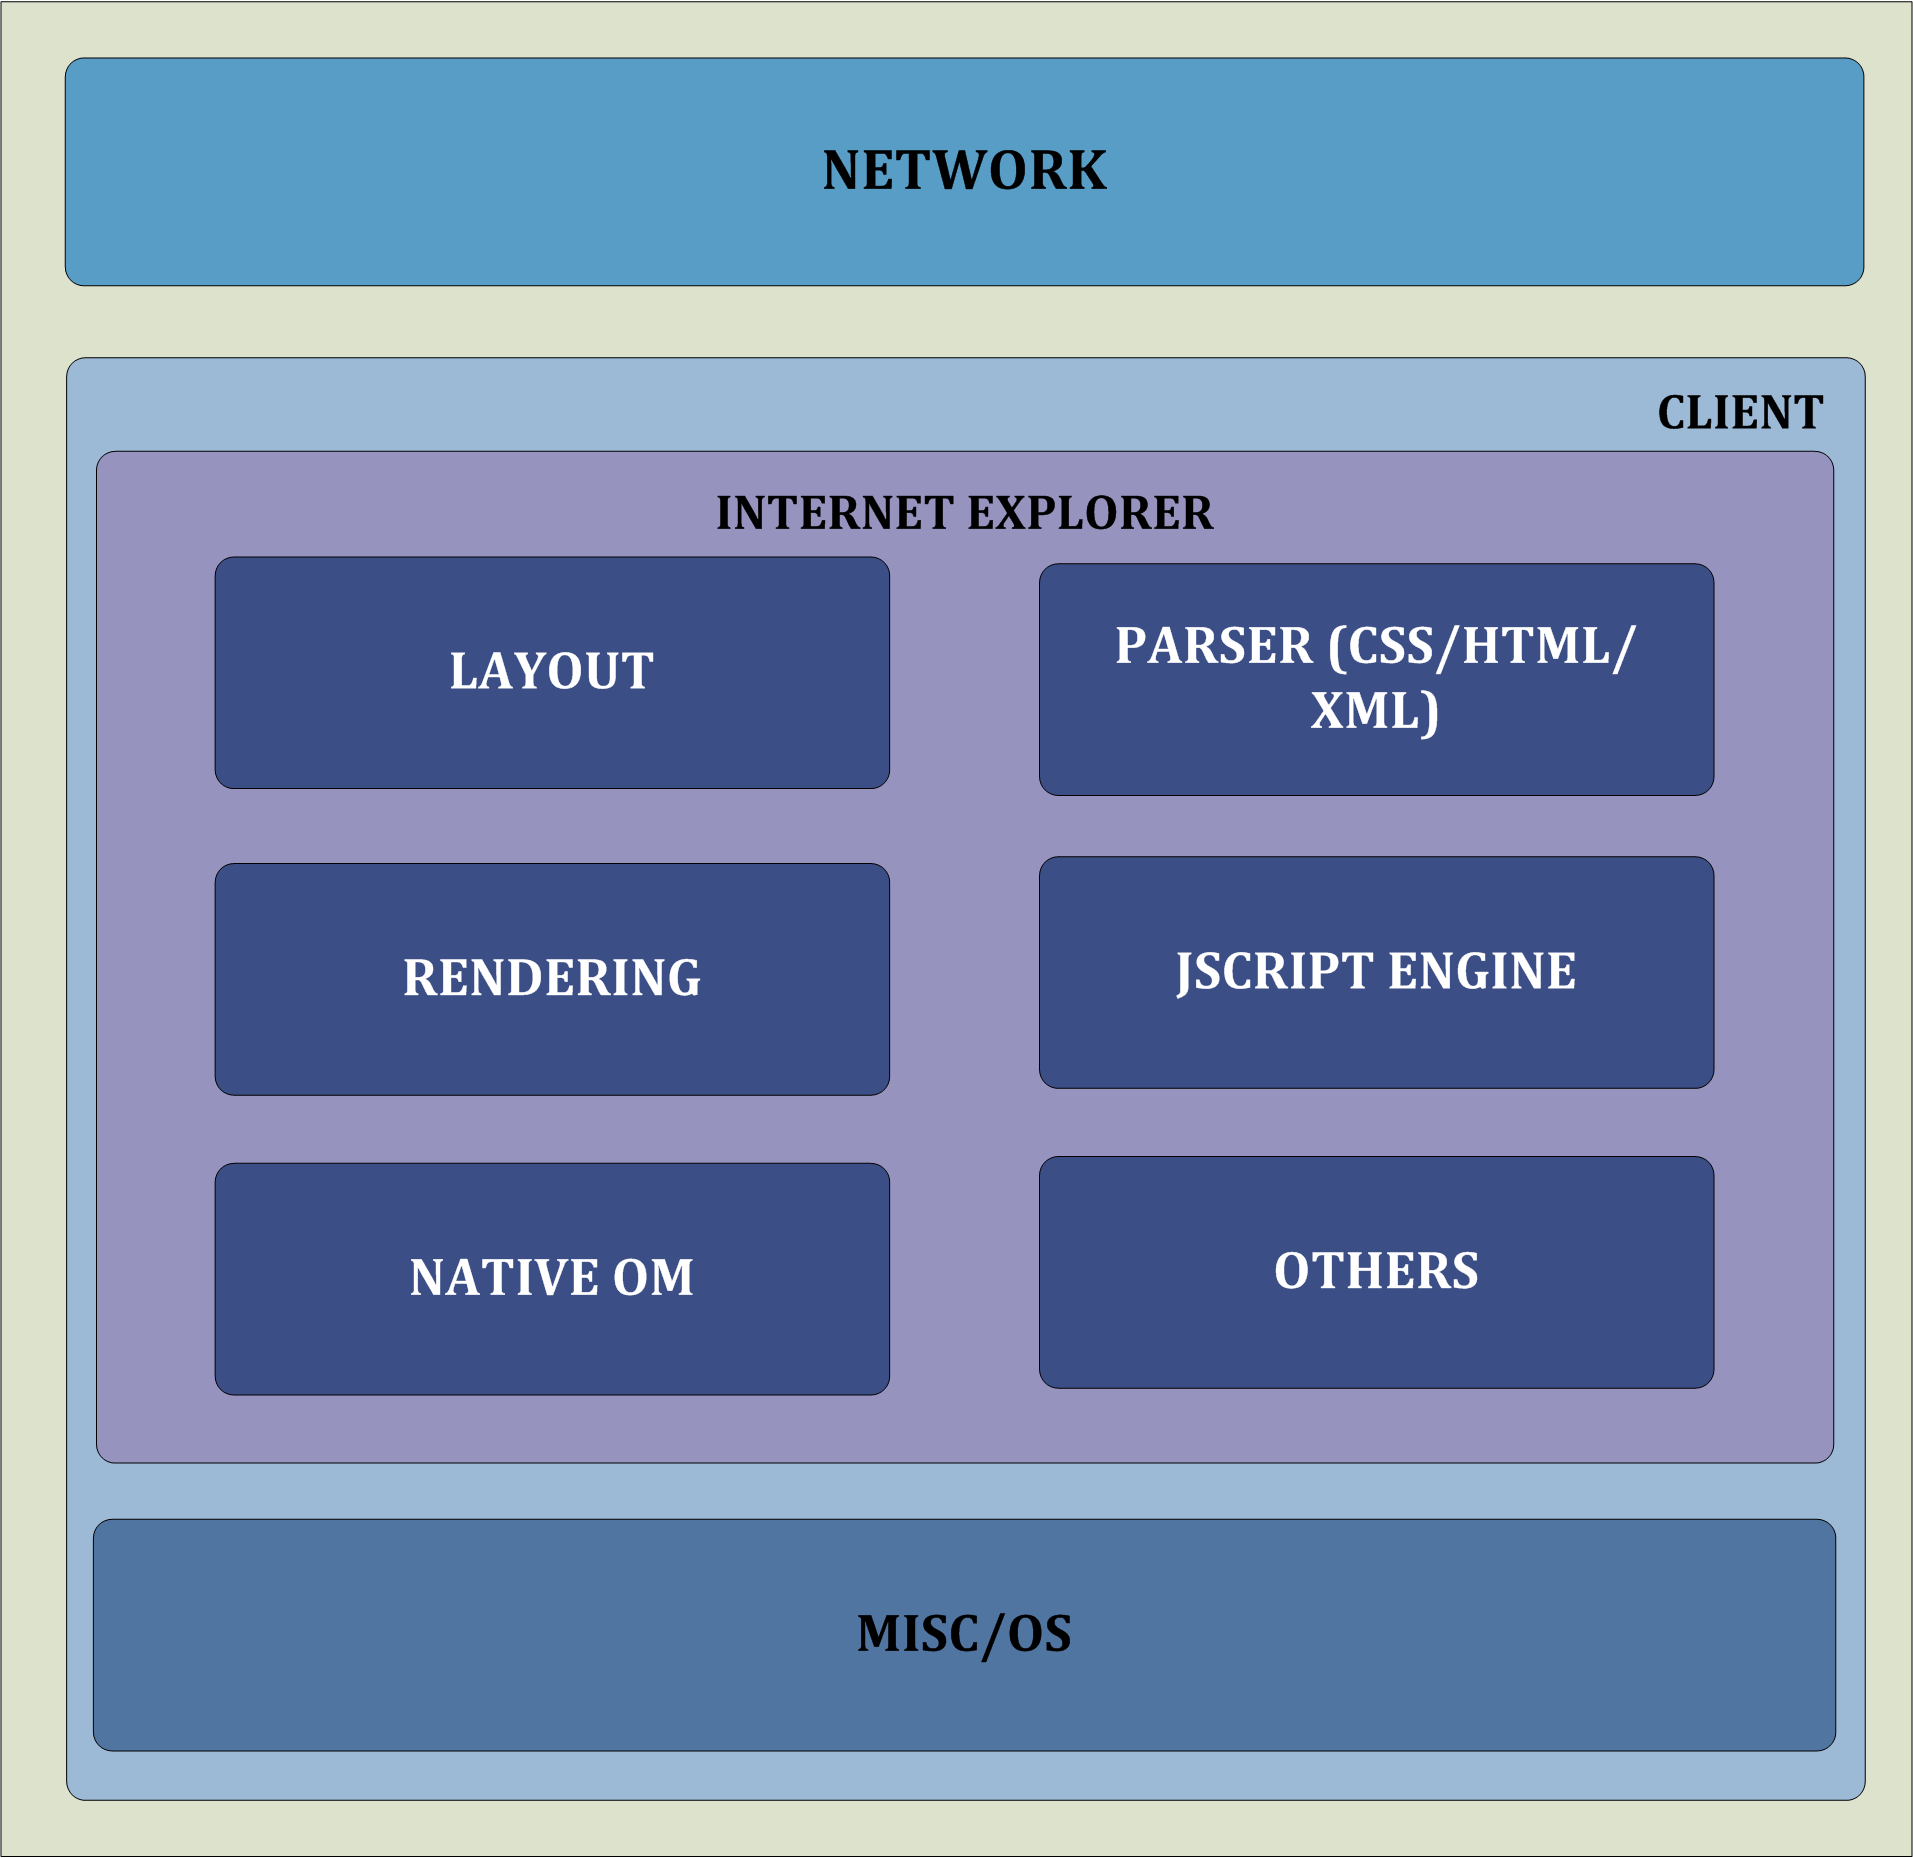
- Network: Whenever a user types in a URL to load a webpage, the browser communicates with the server over the network, and waits for a response from the server. The network is also responsible for asynchronous data exchange between the Web client and the server.
- Parsers: When data is received from the server, it reads, analyzes, and converts the data (HTML, CSS, XML, etc.) into their native object model formats.
- Layout: Internet Explorer's layout subsystem takes input from the parsers and computes the layout of the various components, which form the webpage.
- Rendering: Internet Explorer's rendering engine does the final painting of the page (and any subsequent updates that are required).
- Native OM (or DOM ): The DOM is the object representation of the website's HTML and CSS content. The DOM also acts as a layer for communication between different browser components.
- JScript Engine: The JScript engine represents Microsoft's implementation of the ECMAScript language based on ECMA-262 3rd Edition standard. It contains the basic primitives (functions, objects, types, etc.) for performing various language operations.
Interpreting Micro-benchmarks
There are several micro-benchmarks (for instance, SunSpider, Celtic Kane, RockStarApps, ZIMBRA) cited to compare browser performance on AJAX applications today. These micro-benchmarks typically measure two things:
Microsoft's goal in Internet Explorer?8 Beta 2 was to improve end-user perceivable performance so we were careful not to use micro-benchmarks as a singular metric to focus our engineering effort.
Micro-benchmarks are simple to create, easy to run and provide a quick way for developers to run regressions before making check-ins. But, the use of micro-benchmarks has limitations.
Microsoft's goal in Internet Explorer?8 Beta 2 was to improve end-user perceivable performance so we were careful not to use micro-benchmarks as a singular metric to focus our engineering effort. Instead, we took a more balanced approach and used real world code in addition to micro-benchmarks to drive end-user visible AJAX performance improvement.
Measurement Methodology
We use three different measurements to represent a more holistic view of AJAX performance:
AJAX Subsystem Measurements
We measured AJAX subsystems time profile using the ETW (Event Tracing for Windows) infrastructure in Internet Explorer?8 Beta 2. Using ETW events that mark off AJAX subsystems, we can accurately measure time spent within each AJAX subsystem, including CPU and elapsed time. This data can be collected while running any scenario. A select set of thirty popular websites were run to collect this data. The process in each case is to clear the cache, launch Internet Explorer?8 Beta 2 with a blank page, navigate to the site, wait for 45 seconds (to let any animation/layout settle down) and exit. Each test is run three times and the subsystem profiles are averaged and the run that shows the time closest to the average is used for the analysis. Figure 2 shows the subsystem times for each of these 30 sites.
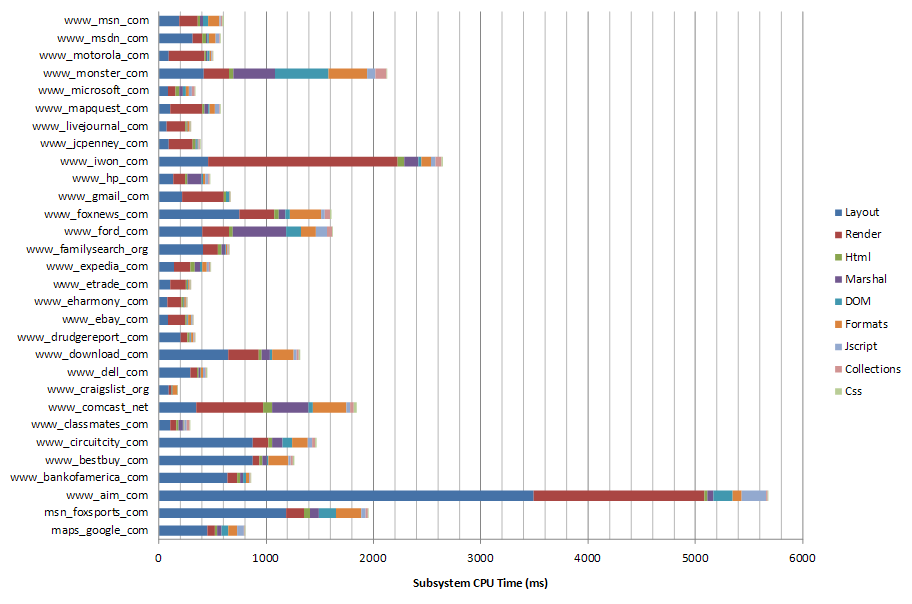
This data shows that the majority of the time spent in the scenarios we measure today is dominated by the layout and rendering subsystems in Internet Explorer?8 Beta 2. This analysis clearly shows why the current set of micro-benchmarks, which concentrate on measuring how fast JavaScript executes, is not a good measure of end-user-perceived performance for today's class of AJAX applications. Note that browser architectures are different, so AJAX subsystems in Internet Explorer?8 Beta 2 (and hence the time profiles) would not be comparable across browsers.
Real-World-Code Measurements
As part of the early access program to get customer feedback, we have been working with a few customers that develop AJAX applications. Part of this engagement includes getting comparative data on performance scenarios on their applications. We worked closely with the Google Gmail product team and focused on making engineering fixes that directly resulted in improved end-user performance. As a result of these efforts, we were able to directly impact commonly used Gmail operations between 15% - 25% compared to Internet Explorer?7. We believe Gmail is quite representative of the current generation of AJAX applications in how they exercise the AJAX subsystems, so we think other AJAX applications will see similar improvements.
This analysis clearly shows why the current set of micro-benchmarks, which concentrate on measuring how fast JavaScript executes, is not a good measure of end-user perceived performance for today's class of AJAX applications.
Measuring real-world code is challenging in many ways. The scenarios are hard to automate and replicate results consistently. Isolating a scenario is difficult and it is very easy to get ?noise? in the measurements that can lead to misleading performance data. Investment needs to be made to add the right level of instrumentation to get consistent and accurate measurements. Working closely with large AJAX customers has been our way to solve some of these challenges and we continue to develop and hone this process.
Micro-benchmarks
Several micro-benchmarks have emerged (ZIMBRA, SunSpider, Celtic Kane and RockStarApps) and SunSpider seems to have become the de facto JavaScript micro-benchmark. In our tests, SunSpider benchmark shows pure JScript performance improvement of over 400% compared to Internet Explorer?7.
Conclusion
AJAX performance measurement is a complex problem and we adopted a structured approach in Internet Explorer?8 Beta 2 to drive targeted performance improvements. Be sure to read the follow-up article in this issue, ?Performance Improvements in Internet Explorer?8? that describes the actual changes.