


Great tools play a critical role in developer productivity, and while many web development tools exist, they likely don't meet your needs in all tasks.
For example, you may want to quickly debug JavaScript, investigate a behavior specific to Internet Explorer, or iterate rapidly to prototype a new design or try solutions to a problem.
In order to improve developer productivity in these and similar scenarios, Internet Explorer 8 Beta 2 includes powerful, yet easy-to-use tools that have a few important characteristics.
Integrated and Simple to Use
Every installation of Internet Explorer 8 Beta 2 includes the Developer Tools. This enables debugging anywhere you find Internet Explorer 8 Beta 2, whether it's your dev machine, test machine, or a client's machine. In addition, by avoiding the use of an extension we limit the impact of the tools on browser performance to only the times when you open the tools. Internet Explorer 8 Beta 2 also includes on-the-fly script debugging so you can enable debugging as needed for only the current Internet Explorer process rather than enabling debugging for all of Internet Explorer and accepting degraded performance and regular script error dialog boxes.
Provide a Visual Interface to the Platform
Instead of reverse engineering how your site works or modifying your site to output debug information, the Developer Tools let you look into Internet Explorer to view its representation of your site. This reduces the time you spend debugging dynamic sites where source inspection isn't useful or investigating a behavior specific to Internet Explorer where a generic authoring tool cannot help.
Enable Fast Experimentation
When prototyping a new design or testing fixes in previous versions of Internet Explorer, you likely edit your source, save it, refresh your page in the browser, and repeat. The Internet Explorer 8 Developer Tools streamline this scenario by letting you edit your site within the browser and see changes take effect immediately.
Optimize Application Performance
Identifying and fixing performance issues is usually an iterative approach done by focusing on one scenario at a time. With the Internet Explorer 8 Developer Tools script profiler, you can collect statistics like execution time and number of times a JavaScript function was called as you test your application and use the profile report to quickly identify and fix performance bottlenecks.
Every installation of Internet Explorer 8 Beta 2 includes the Developer Tools.
With these characteristics, the features of the Developer Tools will dramatically improve your productivity when developing in Internet Explorer. The rest of this article explains many of these features in more detail. For complete documentation of all features, including keyboard shortcuts, visit the Internet Explorer Developer Center on MSDN at http://msdn.microsoft.com/ie.
Getting Started
Getting started with the tools is simple: press F12 or click Developer Tools on the Tools menu of either the menu bar or the command bar. You can also add the Developer Tools icon to the command bar for quick access by right-clicking on the command bar, selecting Customize, and then Add or Remove Commands… Find the Developer Tools icon in the list on the left and click Add. Click Close and the new button will appear in the command bar.
Once open, the tools exist in their own window, each one connected to a single tab in Internet Explorer. If you prefer to decrease the number of open windows, pin the tools within a tab by clicking the ?Pin? button or pressing CTRL+P.
Some features of the tools don't need the complete tools interface. In that case, click the Minimize button or press CTRL+M when the tools are pinned. The tools become a row at the bottom of the window, providing access to all menu items and the document and browser modes without filling all the screen space used by the full user interface.
Inspect and Edit HTML and CSS
The tools give you visibility into the browser so you can inspect your site's HTML and CSS as it exists inside Internet Explorer instead of just the source. This is particularly helpful on dynamic sites, complex sites, and sites that use frameworks like ASP or PHP.
The primary view in the tools displays the site's Document Object Model (DOM) tree, which reflects the one maintained by Internet Explorer to represent the site in memory. You can navigate the tree with the mouse or the keyboard, but a quick way to find the node for a specific element on the page is turning on ?Select Element by Click? and clicking the desired element on the page. The tools will automatically select the corresponding tree node.
If a site uses script to modify the tree, as many do, you'll want to view the latest tree so click the Refresh button in the tools to acquire the latest tree from Internet Explorer.
Inspect Style and Other Information for an Element
Once you've selected an element in the DOM tree, the right-hand pane exposes more information about the element.
When debugging the positioning of an element, use the Layout pane to find box model information such as the element's offset, height, and padding.
The Style pane improves CSS debugging by providing a list of all rules that apply to the selected element. The rules display in precedence order so those that apply last appear at the bottom and any property overridden by another is struck through, allowing you to quickly understand how CSS affects the current element without manually matching selectors.
Instead of reverse engineering how your site works or modifying your site to output debug information, the Developer Tools let you look into Internet Explorer to view its representation of your site.
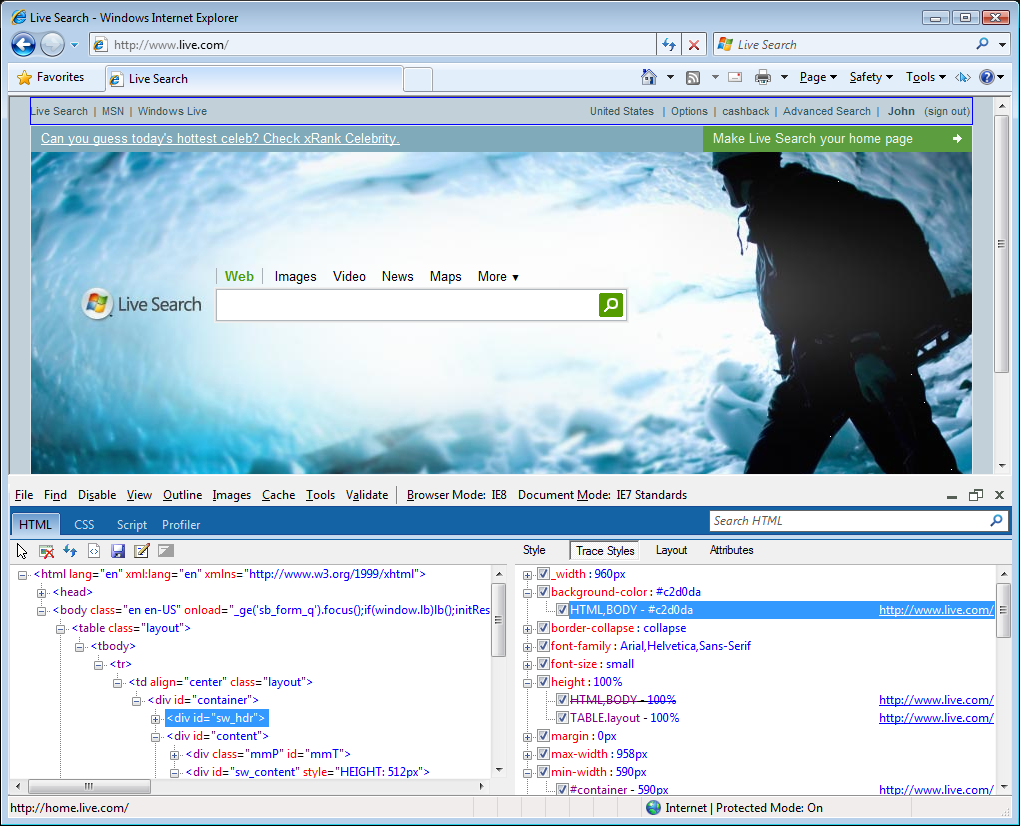
If you're looking for information about a specific property, switch to Trace Styles. This pane contains the same information as Styles except it groups it by property, as shown in Figure 1. Simply find the property that interests you, click the plus, and view a list of all rules that set that property, again in precedence order.
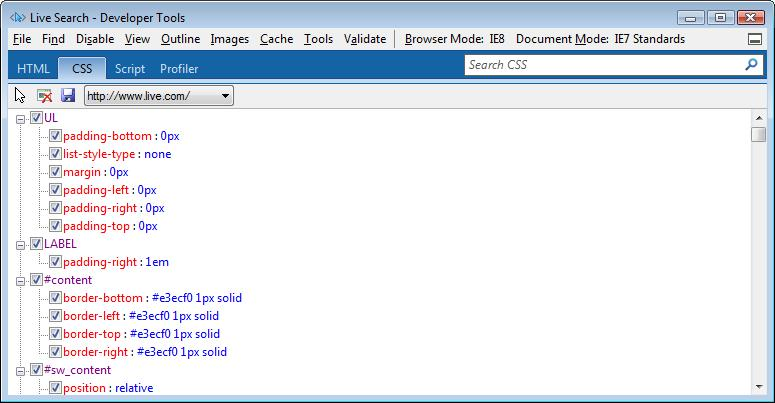
To further inspect CSS, switch to the CSS tab for a list of all CSS files for the current site, as shown in Figure 2.
Live Editing
After using the tools to gather important information about your site, you need to be able to take action quickly. Instead of editing your source, saving, and refreshing, edit within the tools by clicking on HTML attributes and values and CSS rules and properties to make them editable. Just click, type the new value, and press ENTER. The change takes effect immediately so you can quickly test changes. In HTML, you can also press the Edit button to make the entire tree editable and then add, remove, or edit complete elements. In either case, the Developer Tools enable quick editing without modifying your source.
Save Changes
All changes made in the tools only exist in Internet Explorer's internal representation of the site. Therefore, refreshing the page or navigating away brings back the original site. However, in some cases you may want to save the changes. In the HTML and CSS tabs, click the Save button to save the current HTML or CSS, respectively, to a file. Remember that not only will the areas of your site that you modified differ from your source, but other parts may also differ since the tools display your site as it exists in Internet Explorer rather than in your source. To prevent accidentally overwriting source, the tools save the output as text and add a leading comment to the file.
Debug JavaScript
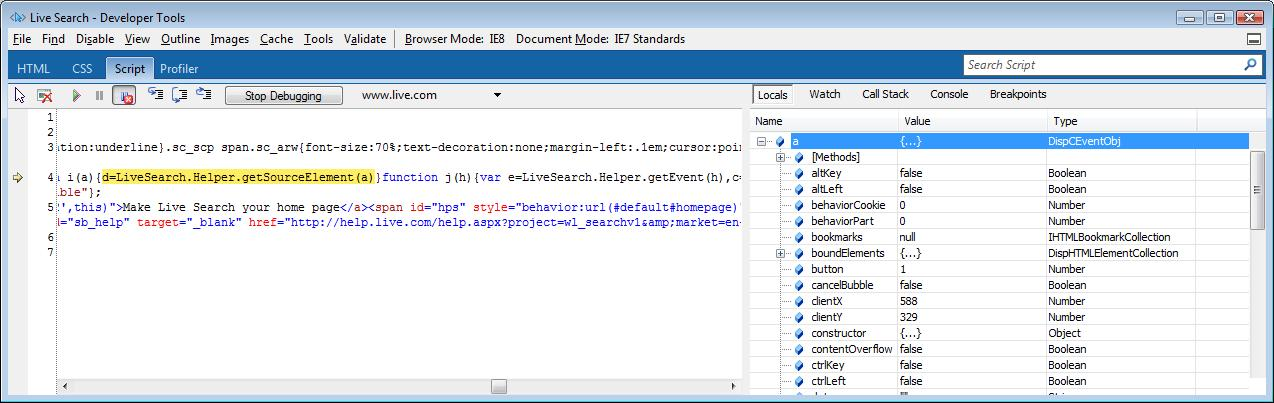
While CSS makes it easier to build dynamic sites without JavaScript, most complex sites still need at least some script. And as with any programming language, a good debugger is critical to being productive and the Developer Tools (Figure 3) provide just that.
Simple to Begin Debugging
Debugging JavaScript in Internet Explorer 8 Beta 2 is simple. On any site you want to debug, open the Script tab and click Start Debugging. That's all there is to it; there is no need to launch a separate application or attach to a process. In previous versions of Internet Explorer, you had to enable script debugging for all of Internet Explorer by changing a setting in the Internet Options Control Panel. However, enabling script debugging reduces browser performance and generates debugging dialogs on any site with a script error, which is frustrating when not debugging. In Internet Explorer 8 Beta 2, Developer Tools includes on-the-fly script debugging, so you can avoid these problems by leaving script debugging disabled and letting the Developer Tools enable debugging for only the current Internet Explorer process. Any new Internet Explorer window will not have debugging enabled until you start debugging in it.
Once started, you have all the functionality you expect from a debugger.
Execution Control
You can pause execution at a specified place by setting a breakpoint. Click a line number or right-click the source and choose Insert Breakpoint. You can set breakpoints within inline functions or event handlers and use conditional breakpoints.
In the HTML and CSS tabs, click the Save button to save the current HTML or CSS, respectively, to a file.
If you're not sure where to set a breakpoint, click Break All to pause execution before the next JavaScript statement runs or Break On Error to pause execution when Internet Explorer encounters a script error. After pausing execution, step through script, including anonymous functions, with Step Into, Step Over, and Step Out.
Variable Inspection
As you step through code, it's helpful to inspect the current state of variables. Within the Script tab, use the Locals pane to view local variables and the Watches pane to monitor a custom list of variables. You can add variables to this list by right clicking it in the source and clicking Add Watch or typing the variable name in the Watches pane.
Navigating Call Stack
As you debug your application by stepping through the JavaScript code, you can view the functions in the current call stack. Clicking on a function in the call stack window displays the source code in the source view window.
JavaScript Console
As with HTML and CSS, the Developer Tools not only give you the information needed to debug your site, but they also make it easy to use that data. Instead of editing your source to test a statement, type the JavaScript in the Console pane to execute it. Click Multi Line Mode to enter large amounts of script. Internet Explorer executes the code immediately so you can test the outcome of adding that code at the same location as the current break. You can use Console even when you are not debugging. To make it easy for you to fix errors on your page, Console also logs all the script errors.
Eliminate ?Alert Debugging? with Console
The Developer Tools offer a powerful feature to help you debug: console.log. Instead of using window.alert and generating countless dialogs, call console.log to output strings to the Console pane. Add variables to the output and use console.info, console.warn, and console.error to vary the formatting of entries in the Console window. Since the Developer Tools Console functionality is similar to that available in Firebug, a Web developer tool for Firefox, debugging notifications will work across browsers without any changes to your script.
Profile JavaScript
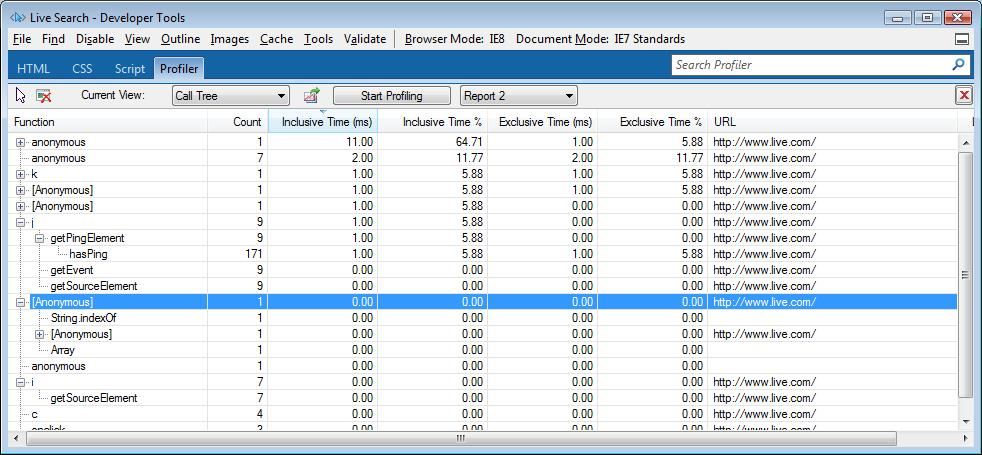
Debugging JavaScript helps perfect the behavior of your site, but the JavaScript profiler can help take your site to the next level by improving its performance. The profiler gives you data on the amount of time spent in each of your site's JavaScript methods and even built-in JavaScript functions like string concatenation. Since you can start and stop the JavaScript profiler at any time during application execution, you can collect profile data for the specific scenario that interests you. Figure 4 shows a screenshot of the profiler.
Starting a Profiling Session
As with the debugger, getting started is simple: open the Profiler tab and click Start Profiling to begin a session. Perform the scenario you want to profile and then click Stop Profiling to view the data.
Viewing Data
By default, the data appears in a function view which lists all the functions used. Click the Current View dropdown menu and select Call Tree to view a tree representing the order of calls made so you can walk through the code path and find hot spots.
Instead of using window.alert and generating countless dialogs, call console.log to output strings to the Console pane.
In both views, you can add, remove, arrange, and sort the columns to find the information you're looking for:
- Right-click a column header and select Add / Remove Columns to customize the view to include exactly the data you're interested in.
- Right-click and select Sort By or simply click a column header to sort the data by that field.
- Drag and drop columns to rearrange them.
The profile report gives you information on the URL and line number of the function to help you locate the code in your application. Click on the function name to bring up the source code for the function in the source view window of the Script tab.
Running Multiple Sessions and Exporting Data
Click Start Profiling again to begin a new profiling session. When you click Stop Profiling, the new data displays. To view the data from previous profiled sessions, click the file dropdown and choose another report. The profile report persists for the current Internet Explorer process, but you can save the profile data in CSV format by clicking Export and use any other application for later investigation.
Test in Different Browser Modes
Internet Explorer 8 Beta 2 has the ability to render pages and report version information as Internet Explorer 7. Web developers and end users can use this ability to ensure sites continue to work even if not built for Internet Explorer 8 Beta 2, but you can also use it to test how your site will look to Internet Explorer 7 users.
Browser Mode
The Browser Mode menu lets you choose how Internet Explorer should report three important properties:
- User agent string: The value Internet Explorer sends to Web servers to identify itself.
- Version vector: The value used when evaluating conditional comments.
- Document mode: The value used to determine whether Internet Explorer uses the most recent behavior for CSS, DOM, and JavaScript operations or emulates a previous version of Internet Explorer for compatibility.
Three Browser Mode options exist, each modifying these values in different ways:
- Internet Explorer 7: In this mode, Internet Explorer reports a user agent, version vector, and document mode identical to those used by Internet Explorer 7. Use this mode to test how Internet Explorer 7 users experience your site.
- Internet Explorer 8: In this mode, Internet Explorer reports a user agent, version vector, and document mode to match default Internet Explorer 8 Beta 2 behavior which is the most standards-compliant available in Internet Explorer 8 Beta 2. Use this mode if you want to test how Internet Explorer 8 Beta 2 users experience your site.
- IE8 Compatibility View: In this mode, Internet Explorer reports a user agent string indicating Internet Explorer 7, but an additional token appended to the string serves as an indication to web servers that the browser is Internet Explorer 8 Beta 2-capable. The version vector and document mode handling are identical to those used by Internet Explorer 7. Use this mode to test how Internet Explorer 8 Beta 2 users experience your site if they've chosen the Compatibility View option.
Document Mode
The Document Mode defines how Internet Explorer renders your page but has no effect on the version vector or user agent string. By using this option in conjunction with the browser mode, you can quickly test which document mode you should use for your site. Three options exist:
- Quirks: This behavior matches that of Internet Explorer when rendering a document with no doctype or a quirks doctype. It's similar to the behavior of Internet Explorer 5 and the quirks mode behavior of Internet Explorer 6, and the same as the quirks mode of Internet Explorer 7.
- Internet Explorer 7 Standards Mode: This behavior matches that of Internet Explorer 7 rendering a document with a strict or unknown doctype.
- Internet Explorer 8 Standards Mode: This behavior is the latest standards-compliant available in Internet Explorer 8 Beta 2 and is the mode used by default in Internet Explorer 8 Beta 2 when rendering a document with a strict or unknown doctype.
There's More!
The Internet Explorer 8 Developer Tools include many other features to help you develop sites in Internet Explorer. Some let you view important information like element class name or image size on the page, while others help with common tasks like matching a color on the screen or measuring a distance. Experiment with the tools yourself to learn more about these and others. Visit the Internet Explorer Developer Center at http://msdn.microsoft.com/ie for complete documentation. And don't forget to follow the Internet Explorer Blog at http://blogs.msdn.com/ie to keep up to date on the latest news from the Internet Explorer team!
Internet Explorer 8 Beta 2 has the ability to render pages and report version information as Internet Explorer 7.