


Over ten years ago, Microsoft SQL Server expanded from being “just” a database engine (and a good one) to a fully integrated Data Warehouse and Business Intelligence platform (which I'll refer to as DW/BI). In the last several years, Microsoft has continued to implement new tools and major functionality to address different DW/BI needs. Additionally, Microsoft has made some key enhancements to the database engine that make SQL Server an excellent choice for large-scale data warehouse applications.
This creates many opportunities for DBAs, developers, and power users to build many different types of information systems. However, the existence of new tools also creates confusion (not surprisingly) about which new tools are the best for certain situations, and even the primary benefits of a new tool. For instance, it can be particularly difficult for a Reporting Services developer to learn the benefits of Integration Services quickly. It also requires some research for an Analysis Services developer to learn what self-service tools like PowerPivot can (and can't) do.
Even at a more fundamental level, developers entering the SQL Server world need a roadmap and a general description of all the tools and services under the SQL Server/BI umbrella. So just like a presidential “State of the Union” speech emphasizes specific achievements and describes specific conditions “as of today,” this article will serve as a State of the Union address for the current state of SQL Server.
What's On the Menu?
This article covers four specific features in the SQL Database engine that have helped SQL Server to become (borrowing from a theme from sports analyst Dick Vitale) a “prime-time player” in the database world. I'm also going to talk about SSIS, SSAS (the two flavors-MOLAP and Tabular, and their two programming languages), SSRS, Integration with SharePoint, and .NET integration with SQL DW/BI.
So, in the traditional Baker's Dozen format, here are the 13 talking points for covering the State of the Union for SQL Server DW/BI.
- An overall view of the SQL DW/BI stack
- Change Data Capture (added in SQL 2008)
- The MERGE statement (added in SQL 2008)
- Baker's Dozen Spotlight: the Columnstore Index (added in SQL 2012 and enhanced in SQL 2014)
- SQL Server Database Engine: In-Memory Optimized Tables (“Hekaton”) (added in SQL 2014)
- SQL Server Integration Services
- SQL Server Analysis Services (OLAP)
- SQL Server Analysis Services (Tabular)
- MDX Programming for SSAS OLAP
- DAX Programming for SSAS Tabular
- SQL Server Reporting Services (SSRS)
- SQL Server/Business Intelligence Integration with SharePoint
- Integrating .NET code with SQL Server DW/BI
Before I begin, a special note. A theme of this article is the capabilities of the SQL Server DW/BI stack, more so than a step-by-step tutorial. In other words, I'll focus more on what you can build, as opposed to how you might build it. For those who want more specifics or step-by-step instructions on certain areas, I've put together a list of webcasts and detailed documents/slide decks that are available on my website. Table 1 lists references to this material, along with URL links and a brief description. At the end of each of the 13 items in this article, I'll mention topics within Table 1 that are specific to that section. Check my website (www.KevinSGoff.net) for more webcasts.
1: The Overall SQL Server DW/BI Stack
Most people know the expression, “A picture is worth a thousand words.” But that's only true if it's the right picture. Figures 1 and 2 (along with a short explanation) help set the stage for this article. Figure 1 represents an overview of many different SQL Server DW/BI environments. While no two SQL Server DW/BI installations have identical topologies, Figure 1 depicts a common set up. The “end game” is a combination of a historical data warehouse and analytic OLAP database, where users can access the data through Excel pivot tables, SSRS reports, custom applications and ad-hoc queries, and possibly SharePoint dashboards. The original source of the data, at the other end of the universe, might be a combination of SQL Server transactional databases, Oracle (or other vendor) databases, FTP feeds, Web service feeds, and Excel spreadsheets. Developers built ETL modules using combinations of T-SQL code and SQL Server Integration Services (SSIS) to retrieve the original source data and load it into staging tables. The new in-memory optimized table structure in SQL Server 2014 can greatly increase the load performance time into/retrieval from staging tables, by a factor of anywhere from two to ten times.
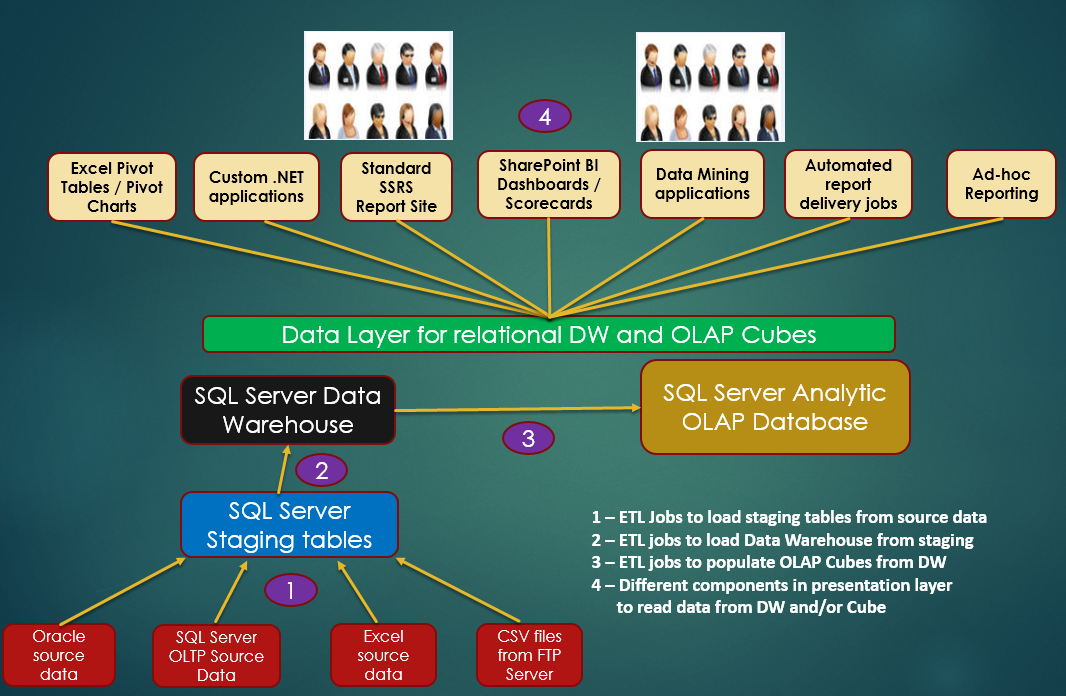
Developers then employ additional ETL techniques using SSIS to populate the data warehouse. Inside of the ETL processes, developers might use Change Data Capture to retrieve all the insertions and updates from a source system, and the T-SQL MERGE statement to insert/update into destination systems using one T-SQL statement instead of separate insert/update DML statements. Reporting systems that query from relational Data Warehouses can (in some instances) use the columnstore index in SQL 2012/2014, which can yield performance gains of anywhere from two to 20 times faster than prior versions of SQL Server.
To create analytic databases, developers use either traditional SSAS MOLAP and MDX code, or SSAS Tabular and DAX code. Once developers establish and populate data warehouses and analytic databases, developers have many options for creating presentation layers with Reporting Services, Excel, and SharePoint Dashboards/Scorecards.
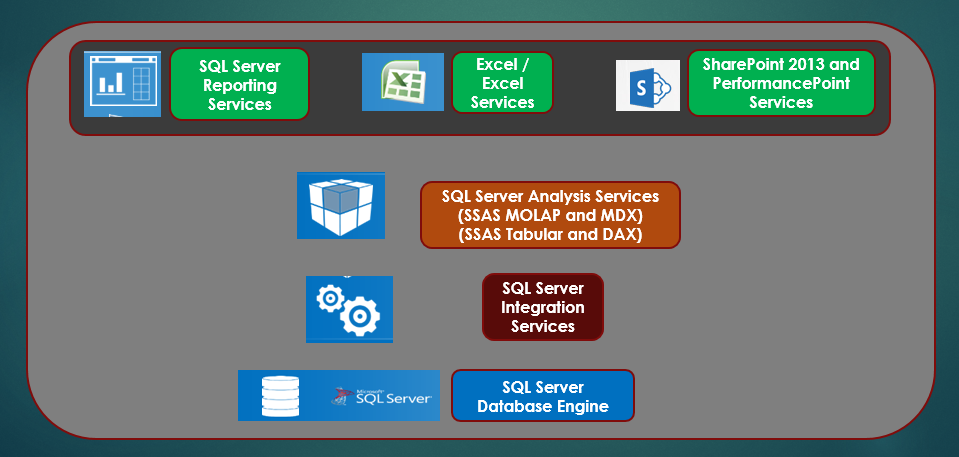
Figure 2 depicts the SQL Server “stack,” as some people call it. The underlying database engine powers much of the SQL DW/BI stack. Microsoft has greatly enhanced the database engine in the last several versions of SQL Server with powerful features that I'll cover in items 2 through 5 of this article. The engines in SSIS, SSAS, and SSRS use the database engine, and therefore benefit from performance and architectural enhancements to the database engine.
There's a level of irony on the learning curves of the back-end tools such as SSIS and SSAS, versus the learning curves of front-end tools such as SSRS, PPS, and Excel Services. The back-end tools tend to take a bit longer to master, though all of them are mutually exclusive (i.e., you rarely have to determine whether to use SSIS or SSAS to perform a task). The front-end tools tend to be a bit easier to use (partly due to the inherent nature of them being visual tools), yet a challenge can be determining which tool to use in which situation. Table 2 lists a breakout of the tools and some guidelines where they are the best fit.
Now let's get back to the database engine. Back around the 2000-2005 time period, some people probably recall comments that SQL Server was a good database management system for medium-size businesses, but didn't scale as well as database offerings from Oracle, IBM, etc., for larger database/data warehouse systems. Whether that statement held water at the time was often an “it depends” proposition. SQL Server 2005 implemented many features into the Transact-SQL language to increase ANSI SQL compliance and also to improve developer productivity - but questions remained whether SQL Server could compete (with Oracle in particular) for larger database installations.
Fortunately, Microsoft focused on functionality in the core database engine to improve scalability and to help SQL Server complete in the data warehousing world. In items 2 through 5, I cover four key engine features: Change Data Capture, the MERGE statement, Columnstore Indexes, and In-Memory Optimized tables.
Additional Reading: In Table 1, Item #1 references a webcast I produced on Data Warehousing Patterns using the SQL DW/BI Tools.
2: Change Data Capture
In SQL Server 2008, Microsoft implemented Change Data Capture. First, a little history. Prior to SQL Server 2008, developers wanted an efficient way to capture the history of inserts/revisions of rows to audit log tables. Most developers implemented audit trail logging using database triggers, custom application code, or the use of the T-SQL OUTPUT INTO feature. These solutions certainly worked (and quite well), although they all involved a rather substantial amount of custom code with limited reusability.
SQL Server 2008 implemented Change Data Capture (CDC), which effectively put audit trail logging into the database engine. Simply by configuring a database for CDC, the database engine writes out a full revision history of row changes to audit trail history tables that you can then query. CDC also has the benefit of querying the SQL Server transaction log asynchronously. This makes CDC potentially faster than database triggers that tend to slow down the original DML statement. For data warehouse environments that want to take the history of inserts and row changes and load them to other tables (perhaps staging tables) as part of an incremental load into data warehouse systems, CDC can be a particularly attractive feature.
- Make sure SQL Server Agent is running. CDC cannot run without Agent running.
- Enable a database for CDC by running the system stored procedure sys.sp_cdc_enable_db.
- Enable CDC on any table where you want to log changes by running the system stored procedure
sys.sp_cdc_enable_table, and passing the name of the table as a parameter, along with the name of the source schema and optionally a role that SQL Server associates with read access, to the change tracking table. - After you run
sys.sp_cdc_enable_tablefor each table, CDC creates a change-tracking table to match the source table. The change-tracking table holds each version of every insertion, update (a row for the old version of the row and a row for the new version of the row), and every deletion.
Additional Reading: In Table 1, Item #2 references a webcast I produced on Change Data Capture.
3: The T-SQL MERGE Statement
SQL Server 2008 added the MERGE feature into the T-SQL language. While I'm focusing on core database engine features, the MERGE statement deserves special attention. MERGE is a mega-command that allows T-SQL developers to perform INSERTS, UPDATES, and DELETES in one DML statement, and redirects the resulting changes to another table. Listing 2 shows a basic but meaningful example of the MERGE, and Figure 3 shows a breakdown of the code.
Listing 2: Example of T-SQL MERGE
CREATE TABLE TargetData_M
    (ID int, Name char(50), Rate Decimal(14,2), ActiveFlag bit)

CREATE TABLE IncomingSourceData_M
    (ID int, Name char(50), Rate Decimal(14,2))

INSERT INTO TargetData_M VALUES
    (1, 'Kevin', 25.00, 1) ,
    (2, 'Steve', 40.00, 1),
    (3, 'Mike',  30.00, 1),
    (4, 'Jason',  35.00, 1)

INSERT INTOIncomingSourceData_M VALUES
    (1, 'Kevin Goff', 25.00),     -- name change
    (2, 'Steve', 41.00),          -- rate change
    (3, 'Mike', 30.00) ,          -- no change
    (5, 'John', 50.00);           -- new person

-- Using ID as the link between the tables:
    -- Post updates from Source to Target
    -- (but only when something changed)

    -- Post insertions when row in source but not target
    -- Mark target as inactive if row not found in source at all

  -- 2 updates, 1 insertion, 1 case where nothing changed,
  -- and 1 case where row not matched by Source

MERGE [TargetData_M] t
    USING [IncomingSourceData_M] s on t.ID = s.ID
        WHEN MATCHED AND (t.name <> s.name or t.Rate <> s.Rate )
            THEN UPDATE SET t.Name = s.Name , t.Rate = s.Rate

        WHEN NOT MATCHED
            THEN INSERT VALUES (s.ID, s.Name, s.Rate, 1)

        WHEN NOT MATCHED BY SOURCE  AND t.ActiveFlag = 1
            THEN UPDATE SET t.ActiveFlag = 0
OUTPUT $Action as Action, Deleted.*, Inserted.*
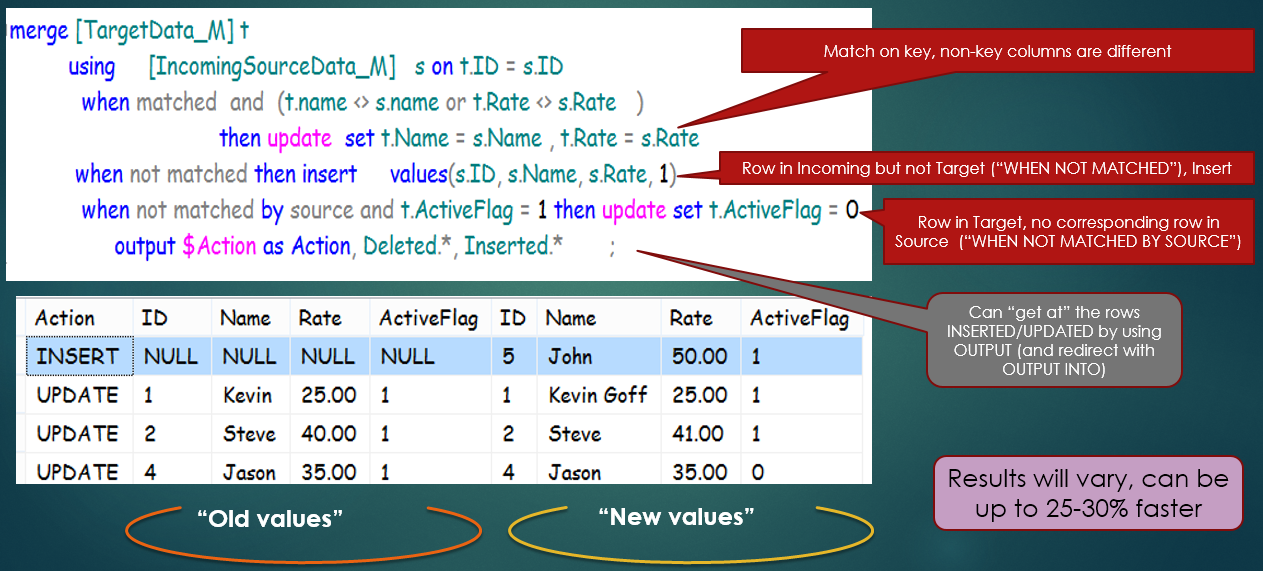
Although MERGE doesn't offer any functionality that developers couldn't previously do with separate INSERT INTO….OUTPUT INTO and UPDATE….OUTPUT INTO statements, MERGE provides a level of efficiency by combining all the actions into one statement. Performance will vary, and MERGE can often perform anywhere from 15-30% faster than separate INSERT/UPDATE statements.
Many data warehouse environments use MERGE as a means of efficiently updating target databases. And, in some instances, the same environments also incorporate Change Data Capture into the process. A scenario might be the following:
- Read from CDC log tables for all inserts/updates deletes that occurred since the last ETL process.
- Use the T-SQL MERGE to INSERT/UPDATE into target tables from the CDC logs, which could be staging tables, or tables shaped as fact/dimension structures in a data warehouse or data mart.
4: SQL Server Database Engine Enhancement: The Columnstore Index
SQL Server 2012 added the new Columnstore index and then enhanced it in SQL Server 2014. The Columnstore index primarily benefits Data Warehouse environments. The name “index” is somewhat of a misnomer, because the columnstore index differs tremendously from traditional row-based indexes. Whereas row-based indexes optimize lookups and searches on specific key values, columnstore indexes are key-less and optimize queries that scan/aggregate over a large number of rows. Microsoft baked so much functionality into the columnstore index that it can be difficult to briefly summarize its power. Here's a bullet point list of the built-in functionality to describe the columnstore index.
- An in-memory, highly-compressed, vector-based structure that leverages duplicated integer values. Imagine a fact table of orders with hundreds of millions of rows, where a single vendor foreign key represents thousands of rows.
- A new optimized cache and buffer pool engine that can read batches of rows in parallel instead of one row at a time
- IO Statistics for queries that use the columnstore index will have a dramatically reduced number of reads
- Smart IO Caching that uses an aggressive read-ahead strategy
- Queries that effectively use the columnstore index can run as much as 10 times faster. Yes, you read that correctly.
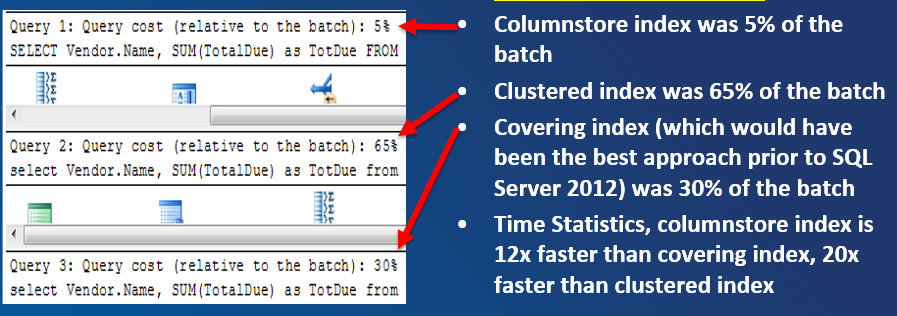
Listing 1 and Figures 4 and 5 show a basic but meaningful example of a query that benefits from a Columnstore index. Historically, queries that scan/aggregate over a tremendous amount of data (i.e., where the query has very little selectivity, such as running for one vendor or one product) tend to cause performance issues. The SQL Server execution operators hash match join and hash aggregation were the most costly of all the operators in the query. The end result was that the query could take minutes or even longer.
Listing 1: Columnstore Index in SQL 2012/2014
-- Create 3 indexes....

-- first, clustered index
 CREATE CLUSTERED INDEX [CL_BigPOHeader]
       ON [dbo].[BigPurchaseOrderHeader]
 ( [PurchaseOrderID])

-- second, columnstore index
-- on ALL columns
 CREATE NONCLUSTERED COLUMNSTORE INDEX [IX_BPO_ColumnStore]
       ON [BigPurchaseOrderHeader]
 (PurchaseOrderID, VendorID, OrderDate, TotalDue)

-- third, a covering index
CREATE NONCLUSTERED INDEX [IX_BPO_Covering]
       ON [BigPurchaseOrderHeader]
 (VendorID)   include (TotalDue)

-- Run 3 queries to summarize sales by Vendor
SET STATISTICS IO ON
SET STATISTICS TIME ON

SELECT Vendor.Name, SUM(TotalDue) as TotDue
    FROM Purchasing.Vendor
        JOIN dbo.BigPurchaseOrderHeader BPO
          ON  Vendor.BusinessEntityID = BPO.VendorID
        -- Unlike the next 2 queries that provide an index hint,
        -- doesn't even provide hint on what index to use        .
        -- SQL Server will use the columnstore index
             GROUP BY Vendor.Name

select Vendor.Name, SUM(TotalDue) as TotDue
    from Purchasing.Vendor
        join dbo.BigPurchaseOrderHeader BPO
             with (index ( [CL_BigPOHeader]))
                -- use clustered index
                   on Vendor.BusinessEntityID = BPO.VendorID
             group by Vendor.Name

select Vendor.Name, SUM(TotalDue) as TotDue
       from Purchasing.Vendor
            join dbo.BigPurchaseOrderHeader BPO
              with (index ( IX_BPO_Covering))
                -- use covering index
                    on Vendor.BusinessEntityID = BPO.VendorID
              group by Vendor.Name
Listing 1 performs an aggregation over a table with 10 million rows, grouping by vendor. The code creates two indexes that you likely created in prior versions of SQL Server:-a clustered index on the primary key and a covering index to optimize queries that retrieved non-key columns (e.g., the Dollar amount). Both of these queries take over a minute to perform. However, the query that uses the new Columnstore index performs in a few seconds! Figure 4 shows the cost of each of the three queries (using the columnstore index, clustered index, and covering index), with the columnstore index query representing a mere 5% of the total execution cost, and running anywhere from 12-20 times faster than the other two queries.
So does the columnstore index query that scans/aggregates over 10 million rows still use the dreaded execution operators hash match join and hash match aggregation? You bet it does! Then how can it run so much faster? Figure 5 shows that Microsoft has introduced a new execution mode for these execution operators: Batch mode (as opposed to Row mode). SQL Server processes batches (blocks) of roughly one thousand rows, in parallel, in a new optimized buffer pool. So as I stated above in the bullet point list of functions, Microsoft has baked a significant amount of functionality into the database engine to work with columnstore indexes.
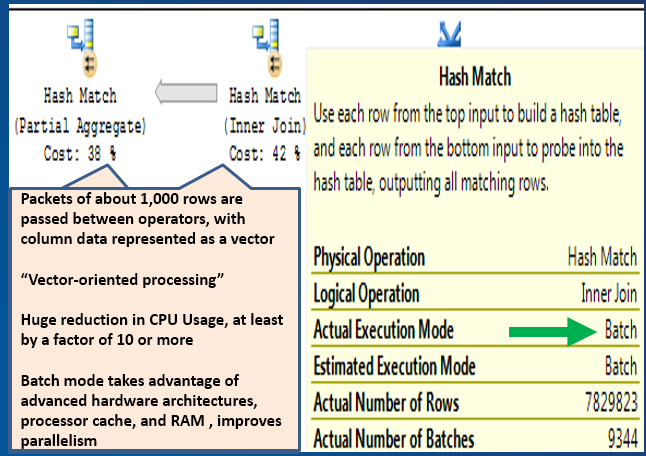
Microsoft has baked a significant amount of functionality into the database engine to work with columnstore indexes.
In SQL Server 2012, the columnstore index was a read-only index. This meant that the only practical scenario was a process where database jobs rebuilt data warehouse fact tables on a scheduled basis (e.g., every night) and then rebuilt the index. However, SQL Server 2014 provides an option to define a columnstore index as a read/write index, so long as you create it as a clustered columnstore index.
Additional Reading: In Table 1, Item #3 references a very detailed slide deck on the Columnstore Index.
5: SQL Server Database Engine Enhancement: In-Memory Optimized Tables
SQL Server 2014 added the new In-Memory Optimized table feature (known during the release of SQL 2014 as “Hekaton”). In-Memory optimized tables provide a more efficient rowstore with less overhead that make it ideal for staging tables, bulk insert/bulk updates, holding session state data where fast read/writes are necessary, and heavy random reads. This is new functionality that will probably need one more release to address limitations, but it's certainly a feature that works extremely well when developers can take advantage of it (for instance, generating anywhere from 2x to 10x increases in performance during staging table processing).
In-Memory Optimized tables provide a more efficient rowstore with less overhead that make it ideal for staging tables, bulk insert/bulk updates, holding session state data where fast read/writes are necessary, and heavy random reads.
The steps to use this functionality are:
- Create a new database (or alter an existing database) and add a
FileGroupfile with the MEMORY_OPTIMIZED_DATA keyword. - Specify that the collation sequence is Latin1_General_100_BIN2. BIN2 collation is required to join character data in In-Memory optimized tables.
- Create new tables using the WITH (MEMORY_OPTIMIZED=ON) statement, and define the DURABILTY as SCHEMA_ONLY or SCHEMA_AND_DATA. The SCHEMA_ONLY setting means that any data is lost when the SQL Server service stops running, and SCHEMA_AND_DATA means SQL Server retains the data if the service stops. The former durability mode is generally faster but won't save data if the service stops, so it's generally recommended for staging tables. The latter durability mode is not quite as fast, but SQL Server preserves the data.
- Define indexes either as hash indexes for single value lookups or range indexes for lookups across a range of values, such as dates.
SQL Server has implemented new functionality in the database engine to manage In-Memory Optimized tables in a more simplified and efficient manner. In-Memory Optimized tables do not feature locking and latching, nor any type of paging, logging, or fragmentation, all of which lead to reduced overhead and increased performance.
SQL Server has dramatically improved as a viable option for large-scale database/data warehouse applications because of these four features. Certainly other new features in SQL Server deserve a highly honorable mention as well, such as:
- Enhanced Partitioning
- Compression and Data Encryption
- AlwaysOn High Availability
- Master Data Services
- Star join optimizations
Having said that, the four I've discussed in this article have been major to the point of being game changers. Note: Change Data Capture, Columnstore Indexes, and In-Memory Optimized tables are only available in the Enterprise edition of SQL Server.
Additional Reading: In Table 1, Item #4 references a detailed slide deck on In-Memory Optimized databases.
6: SQL Server Integration Services
SQL Server 2000 introduced a feature called Data Transformation Services (DTS) that allowed database developers to open data from difference sources, manipulate the data, and load it somewhere else. This is the fundamental scenario for ETL (Extract/Transform/Load) operations. Unfortunately, DTS contained significant limitations that led many database developers to conclude (at the time) that they were better off writing custom procedures in combinations of languages like C, C#, VB.NET, and T-SQL. (I include myself in that group of developers.)
But then Microsoft released SQL Server 2005, which included massive enhancements to DTS, along with SSAS and SSRS (which I'll cover later in this article). The enhancements to DTS were so significant that Microsoft gave it a new name: SQL Server Integration Services (SSIS). Microsoft also formally branded SSIS, along with SSAS and SSRS, as the services to form the Microsoft Business Intelligence brand. The enhancements in SSIS 2005 also gave developers a reason to give a serious second look at Microsoft's ETL offering.
Microsoft also made some enhancements - including performance enhancements - in SQL Server 2008 and then another set of substantial enhancements in SSIS 2012. The SSIS learning curve is also substantial: part of the learning curve includes awareness of common (and less common) scenarios where developers use SSIS. Here's a partial list:
- Reading database data (from SQL Server, Oracle, etc.) and writing out an Excel file with multiple workbooks
- Loading data from CSV or XML files, performing lookups to validate the incoming data, writing out valid rows to one set of tables (and invalid data to error tables) and generating emails with summary results from the process
- Retrieving files from an FTP server, iterating through each of the files one at a time, opening the contents of the file, writing out the information to other systems, and logging the results
- Populating a data mart/data warehouse, and rebuilding an OLAP cube from the sources of the OLAP cube, and then generating an SSRS report to a PDF that summarized the load process
- Implementing Slowly Changing Dimension Processing (i.e., detecting changes in master table data that you wish to preserve historically)
- Opening Excel spreadsheets, converting the data to different data types, splitting the rows based on different conditions, and writing out multiple output files based on the rules of the splitting
- Using inexact lookup logic (“fuzzy lookups”) to perform potential matches based on spelling errors
Because SSIS is now roughly nine years old and has become a popular tool for ETL processing, developers have formed both methodologies and opinions about how to best use SSIS. Some developers use nearly all of the major functions in SSIS for processing data, and other developers (usually those dealing with substantial loads of data) build hybrid solutions that leverage some of the workflow features in SSIS with SQL Server stored procedures. The latter group tends to minimize the use of SSIS data flow operations, and elect instead to gain every last bit of possible performance with stored procedures. The key thing to remember here is that using SSIS means you can use SSIS and stored procedures, versus the perception that it's SSIS or stored procedures.
The key thing to remember here is that using SSIS means you can use SSIS and stored procedures, versus the perception that it's SSIS or stored procedures.
Additional Reading: In Table 1, Items #5 and 6 reference some prior CODE Magazine articles I've written on SSIS, as well as links to starter videos on building SSIS packages.
7: SQL Server Analysis Services (Multi-Dimensional OLAP)
I've lived and breathed and slept the entire SQL Server platform for over a decade now. Although I love many aspects of SQL Server, my personal favorite tool is Analysis Services (SSAS).
To understand what SSAS is, you need to think in terms of what business users want out of database and data warehouse systems. Among other things, users want the ability to easily retrieve information, to “slice and dice” data by different business dimensions, to review visual scorecards that reflect key business metrics (such as profit, costs, quality control, etc.), and to analyze trends in business performance, and they want to be able to do all of this quickly. Additionally, database administrators want the ability to define which users can see what data, ideally without writing much custom code.
Can developers accomplish these tasks with relational databases, custom stored procedures, and powerful reports? Of course they can. But another approach is to use OLAP technology, and specifically SSAS. OLAP provides developers with the ability to join/cement together business metrics (sales, profit, costs, and tallies) by business dimensions and dimensional hierarchies (product brands/categories/subcategories, sales regions/zones/markets/accounts, etc.). Users can then navigate the OLAP database using tools like Excel, which in turn seamlessly makes calls back to the OLAP engine. The OLAP engine can aggregate (“roll up”) data in the OLAP database very rapidly.
Microsoft had an early OLAP Services tool in the late 1990s, and then created the first version of SSAS in SQL Server 2000. The early versions showed promise but ultimately had significant limitations. Developers consider SSAS 2005, like SSIS 2005, to be the first serious and sophisticated Microsoft OLAP tool. Microsoft added some very nice enhancements in SSAS 2008, further establishing SSAS as a powerful OLAP tool for delivering analytic databases to business users.
Developers create the definition for OLAP analytic databases (or “OLAP cubes” as some describe them) using a special version of Visual Studio called Business Intelligence Development Studio (BIDS). In more recent times, BIDS has evolved into SQL Server Data Tools - Business Intelligence Edition (SSDT-BI). Many have noted that the learning curve in building SSAS projects is particularly difficult, with a large number of intricate options that require a measureable amount of research and understanding. For this reason, SSAS has a reputation of being difficult to learn. Although I love SSAS, I understand the observations about the learning curve, especially after having taught it for years. Microsoft attempted to address the learning curve with a new flavor of SSAS in SQL Server 2012.
Additional Reading: In Table 1, Items #7, 8, and 9 reference some prior CODE Magazine articles I've written on SSAS, as well as starter videos on building SSAS projects.
8: SQL Server Analysis Services (SSAS Tabular)
Starting in SQL Server 2012, SSAS comes in two flavors. First, there is the traditional SSAS tool that developers frequently describe as SSAS OLAP, SSAS MOLAP, SSAS Multi-Dimensional, etc. Second, there is SSAS Tabular, which is essentially targeted toward newer developers with the promise of an improved Visual Studio interface and easier learning curve. SSAS Tabular can generally produce results similar to traditional SSAS OLAP, although trying to reproduce complex SSAS OLAP solutions using SSAS Tabular sometimes exposes functional limitations in SSAS Tabular. Additionally, implementing advanced functionality in SSAS Tabular also results in learning-curve challenges as well. Still, SSAS Tabular does offer some opportunities to build analytic solutions in a slightly easier fashion.
SSAS OLAP and SSAS Tabular use two expression languages, MDX and DAX (respectively). I'll cover them next.
Additional Reading: In Table 1, Item #10 references a prior CODE Magazine article I wrote on building SSAS Tabular Projects.
9: MDX Programming with SSAS MOLAP
MDX is the programming language for SSAS OLAP databases. Loosely speaking, MDX is to SSAS OLAP as T-SQL is to relational databases.
Initially, MDX looks similar enough to T-SQL that some SQL developers assume that the learning curve might be minimal. Unfortunately, MDX is arguably more difficult. Here are some of the differences between T-SQL and MDX:
- Because OLAP databases are (by definition) multidimensional, MDX queries must provide information on the row axis and column axis definitions.
- Because OLAP databases (in essence) provide the “special glue” to associate business measures with business dimensions, developers who write MDX queries need to realize that the SSAS engine will always deal with the context of the current query. This is both a good thing and a tough thing: It's good because MDX is usually fewer lines of code than T-SQL, but tough in that the MDX queries are more abstract.
- MDX Syntax rules for curly braces, parenthesis, and colons can be difficult to learn.
Having said all this, MDX is an extremely powerful language that leverages the analytic capabilities of SSAS MOLAP.
Listing 3 shows an example of moderately complicated query - retrieving the top three products by sales, and for each of the three products, the top three cities by sales.
Listing 3: TOPCOUNT within TOPCOUNT using MDX
with set [TopNProducts] as
    topcount( [Product].[Product].Children, 3,
              [Internet Sales Amount])

set [TopCitiesWithinTopProducts] as
    GENERATE ( [TopNProducts],
        ( [Product].[Product].CurrentMember,
            TOPCOUNT( [Customer].[City].Children, 3,
                [Internet Sales Amount] ) ) )

member [CityRank] as
        RANK(  ( [Product].[Product].CurrentMember,
                 [Customer].[City].CurrentMember),
         exists( [TopCitiesWithinTopProducts],
             [Product].[Product].CurrentMember))

member [Product Rank] as RANK(
        [Product].[Product].CurrentMember, [TopNProducts])

select { [Internet Sales Amount], [Product Rank], [CityRank]} on columns,
        [TopCitiesWithinTopPRoducts]
            on rows
from [Adventure Works]
The code illustrates the following concepts in MDX:
- The use of named sets to build a collection of member values (cities and products)
- The use of topcount to retrieve the top N members, based on some measure (sales)
- The use of the
RANKfunction to assign a scalar numeric value for each member in a set, based on an order - The use of the
GENERATEfunction to build a list of top cities for each of the top products - The
ON COLUMNSandON ROWSstatements to define the row and column axis for the output
Here are two additional MDX code snippets. The first demonstrates how to express a dollar amount figure in terms from one year ago, using the MDX ParallelPeriod function and a Ship Date hierarchy. The second shows how to calculate a 12-month moving average, using the MDX LastPeriods function and a Ship Date hierarchy. Although it can take months (or even years) to become strong in MDX, these code snippets demonstrate one of the hallmarks of MDX - expressing aggregated data in terms of related dimension member values.
( [Amount],
    Parallelperiod(
        [Ship Date].[Date Tree].[Fiscal Year],1) )

avg(
    LastPeriods( 12,
        [Ship Date].[Date Tree].PrevMember),[Measures].[Amount] )
SSAS OLAP developers use MDX for custom queries for reports, calculation expressions, Key Performance Indicator (KPI) logic, and reusable sets of dimension member values. MDX is a complicated language, arguably more difficult to learn than T-SQL. Developers who build OLAP databases are practically required to know MDX. Additionally, each tool that allows developers to incorporate MDX code have their own nuances. For instance, there are specific things you'll need to know when incorporating MDX code into SQL Server Reporting Services.
Additional Reading: In Table 1, Item #11 references a series of training videos on MDX. Also, Item #12 references a prior CODE Magazine article on getting started with MDX programming.
10: DAX Expressions with SSAS Tabular
SSAS Tabular developers use a language called DAX (Data Analysis Expressions). DAX is different than MDX in the sense that you cannot use DAX to write full-blown queries that return COLUMN and ROW axis results. DAX is only used for expressions. Additionally, there is some controversy in the industry over the common claim that DAX is easier to learn than MDX. Like most things, “it depends.” Sometimes DAX can be a little easier than MDX, but other times DAX can be just as complicated as MDX. The following is a snippet of a DAX formula to rank cities by the sum of reseller sales amount.
=if(countrows( values ( Geography[City]))=1,
 IF(NOT(ISBLANK( VALUES ( Geography[City] ))),
    RANKX(   all( Geography[City]),
        ResellerSales[Sum of SalesAmount Reseller]),BLANK()),BLANK())
11: SQL Server Reporting Services
Of all the tools in the SQL Server/Business Intelligence stack, SQL Server Reporting Services (SSRS) is arguably the most popular and well-known of all the areas of the SQL BI stack. SSRS debuted as part of SQL Server 2000, and unlike the equivalents on the ETL/OLAP end (DTS 2000 and SSAS 2000), SSRS 2000 was a bit stronger for a first effort. It certainly wasn't a perfect product and it certainly paled in comparison to more established reporting tools like Crystal Reports, but it was suitable for many basic Web reporting requirements.
Microsoft made major enhancements in SSRS 2005, SSRS 2008, and SSRS 2008R2. Although SSRS still doesn't have every last feature that Crystal Reports has, it has grown up to be a mature reporting platform. One of the benefits of SSRS is that developers can build reports against many data sources, including SQL Server (both relational and OLAP/tabular), Oracle, Teradata, SharePoint Lists, and even custom data extensions. SSRS can handle a variety of output formats, such as tabular, matrix, hybrid tabular/matrix, and even decent charting requirements.
One of the challenges of SSRS is knowing exactly what type of output can be created. Sometimes developers prematurely assume that they need to purchase a third-party charting tool to generate specific output that SSRS can generate (albeit sometimes with considerable effort). Even as recently as SQL Server 2005, SSRS was quite weak in generating presentation output.
Here are some of the major enhancements over the years in SSRS:
- Much better charting and visualization options, such as the ability to plot multiple Y-axis data definitions, sparklines, and performance gauges
- A powerful Matrix control that allows developers to render pivot-style data in a report. The Matrix control permits multiple adjacent (i.e., non-parent-child) groupings, and even allows hybrid output (a combination of pivoted and free-form data).
- The ability to report on multiple datasets in one table using new
LOOKUPandLOOKUPDATASETfunctions - Improved performance over SSRS 2005, which required IIS. SSRS 2008 and later uses the SQL Server network stack and redesigned services, generally yielding better performance.
- SSRS 2012 can run in SharePoint 2010 and later as a standard SharePoint service application, providing better integration and slightly improved performance.
- Data Alerts in SSRS 2012 along with SharePoint 2010 and later, which alert users of report data changes
- Nested page groups
- Support for mapping geospatial data
SSRS has contained features such as data-driven subscriptions, subreports, report actions, and drilldown/hot-links from one report to another going back to SSRS 2005, although the enhancements above certainly serve to bolster older SSRS functionality.
One of the primary themes of this article's content is to focus on what can be built. Figures 6 through 9 show some moderately involved report output with SSRS:
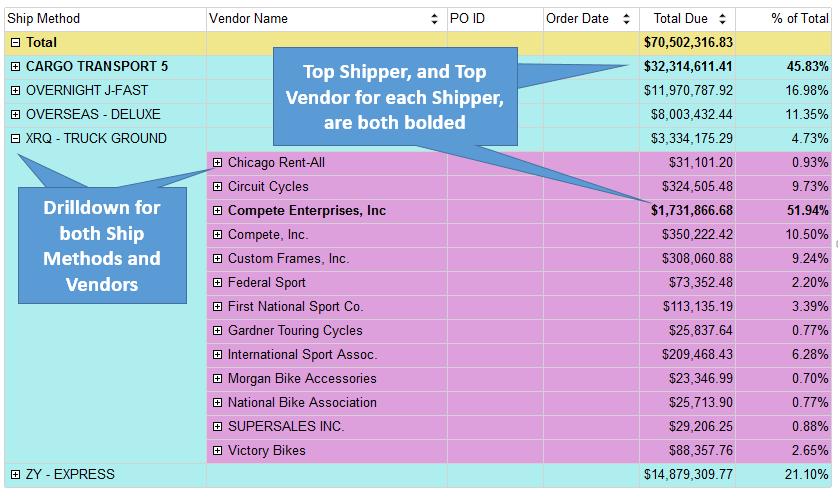
- Figure 6 shows an example of drilldown capabilities, revealing or suppressing lower-level details. I've found this feature to be important when users want Excel-style expand/collapse of hierarchies in Excel Pivot tables. The report also demonstrates the ability in SSRS to dynamically format certain expressions based on a condition. In this example, the report highlights the highest shipper (based on dollars), along with the highest vendor inside each shipper. The expressions to set dynamic formatting are sometimes complicated and must adhere to any scoping rules regarding groups in the report. I know I've beaten my head on the desk a few times trying to get complicated dynamic expressions to work, but they certainly provide some strong capabilities.
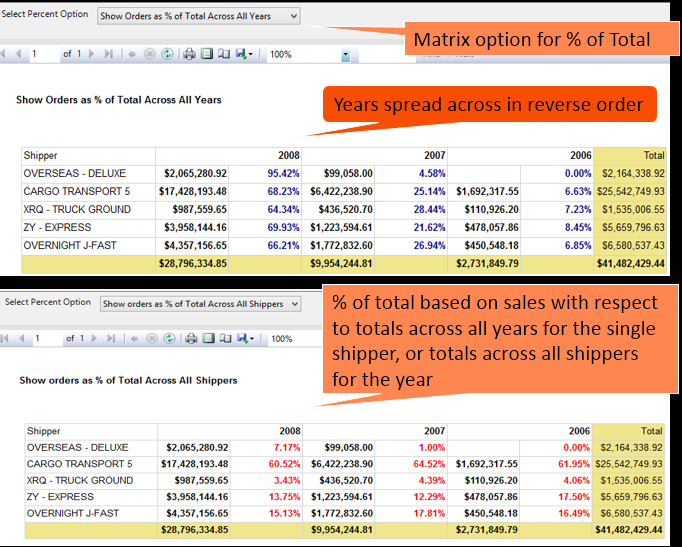
- Figure 7 displays an SSRS matrix report. To this day, many SSRS developers acknowledge that they've never tried the matrix report control. You can use the matrix when you have business values to spread across the columns axis (such as salesman, product groups, years, etc.), or in layman's terms, “across the top.” The matrix provides the ability to dynamically pivot content across the top without knowing the values of the spreading element. (By contrast, the T-SQL PIVOT statement requires you to specify the values of the spreading element, unless you revert to dynamic SQL). Figure 7 also demonstrates a powerful matrix feature that Microsoft added to the matrix in SQL Server 2008: the ability to have multiple expressions per spreading element (i.e., the percentage of the total) and render just one of them at runtime based on a user parameter (i.e., showing % of row total or % of column total).
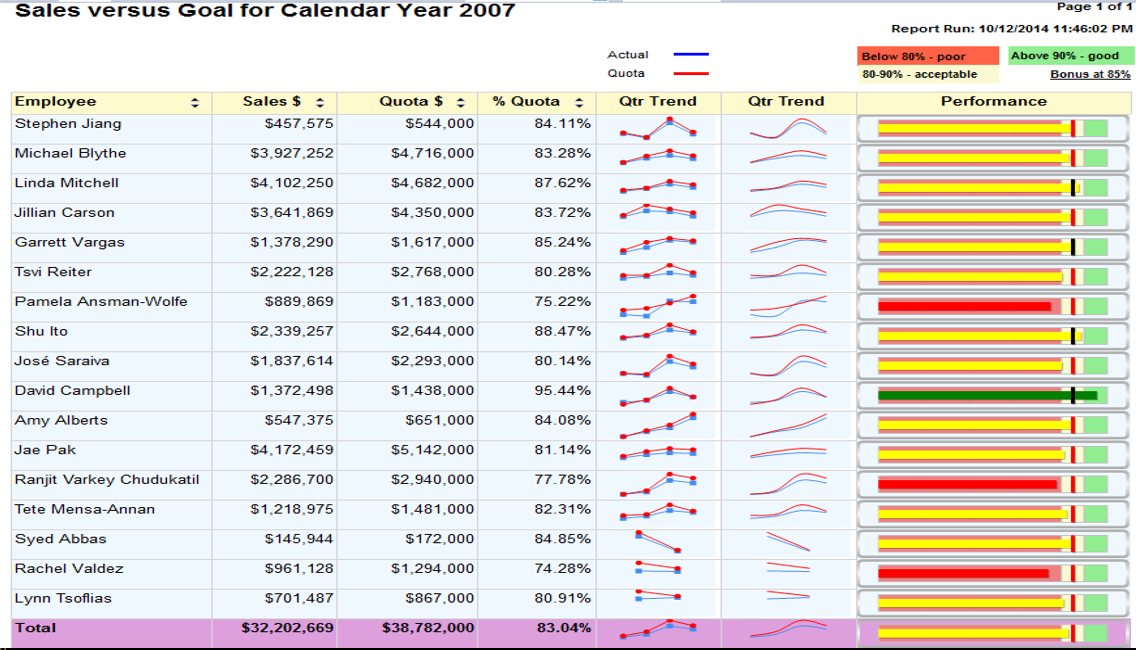
- Figure 8 shows one of the most visually impressive features that Microsoft added to SSRS 2008: performance gauges. These can serve as a visual Key Performance Indicator (KPI) with the additional ability to visually show (through a condensed progress bar) how close a measure is to a certain goal. Figure 8 shows employee sales as a percent of sales goals, with rules for “good,” “not good,” and “somewhere in between.” This capability puts SSRS on par with dashboard tools that visually depict performance. Finally, Figure 8 shows a highly compressed line chart known as a sparkline, which Microsoft added in SQL Server 2008R2. The sparkline is much like a regular chart, with the legend, tick marks, and all annotations removed. The sole intention is to show a quick visual of trends.
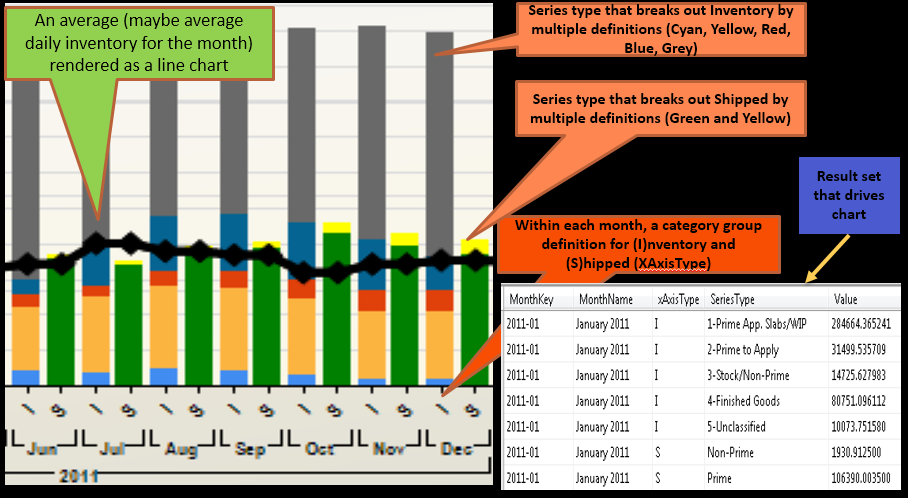
- Figure 9 shows an advanced feature in SSRS charting: the ability to have multiple sets of series groups within a report category or subcategory. This is an instance where preparing the result set (to be able to provide series and category groups) is half the battle!
One final point, something I've stressed in development environments for over a decade. SSRS developers always need to understand data access strategies, SQL or MDX code (for retrieving relational or OLAP data), parameter handling, report delivery, etc. The report designer itself, while certainly very important, represents just a portion of the total development effort required to build reporting applications.
SSRS developers always need to understand data access strategies, SQL or MDX code (for retrieving relational or OLAP data), parameter handling, report delivery, etc. The report designer itself represents just a portion of the total development effort.
Additional Reading: In Table 1, Item #13 references a four-part video on creating the entire performance gauge report in Figure 8. Item #14 references a detailed slide deck on creating data-driven subscriptions in SSRS.
12: SQL Server Integration with SharePoint
There's no formal survey that provides the percentage of SQL DW/BI environments that use SharePoint. I've also found as a consultant that some organizations have a SharePoint Enterprise licenses for either SP 2010 or 2013, but have barely scratched the surface of SharePoint's capabilities.
Here are some of the ways the SQL DW/BI stack can integrate with SharePoint:
- Integrating SSRS Reports with SharePoint and scheduling SSRS reports to render output to user SharePoint document libraries
- Deploying Excel Pivot tables against OLAP Cubes to SharePoint, so that users can interact with them, even if the user doesn't have Excel installed
- Creating custom scorecard and dashboard libraries using SharePoint Web Parts
- Creating custom scorecard and dashboard libraries using PerformancePoint Services, which works primarily with SSAS Analytic OLAP/Tabular databases, provides a layer on top of SharePoint Web Parts and provides some interesting functionality
Once again, this is a topic that could span an entire article. I'll show two examples just to give you a taste. Figure 10 shows an example of a SharePoint PerformancePoint Services dashboard page. The page contains a KPI scorecard to visually depict sales performance, along with “hot-links” so that a user can click on a portion of the scorecard and display a more detailed chart or grid on the right side of the page. If you know something about SharePoint development, you might suspect (correctly) that PerformancePoint Services provides a layer on top of SharePoint Web parts, allowing developers to focus on the general output for each segment of the page without dealing with the specifics of Web parts.
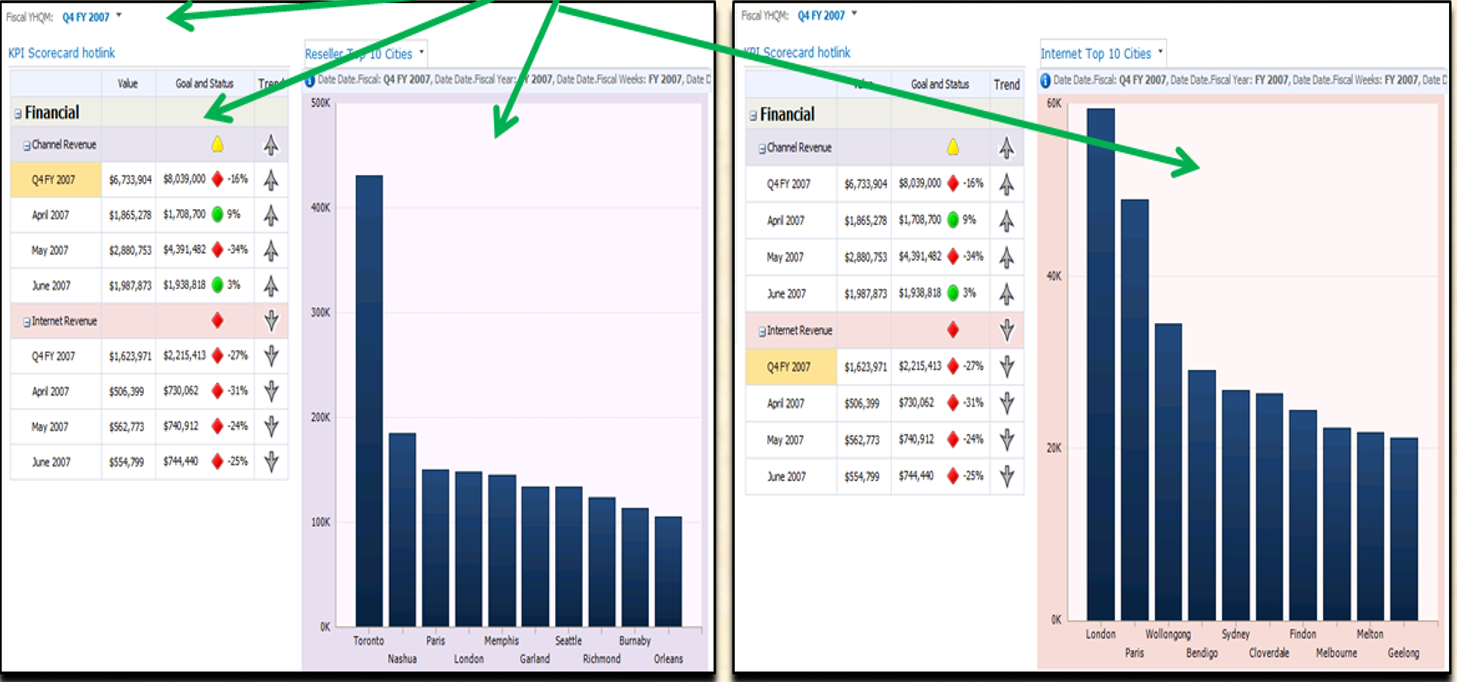
PerformancePoint Services is a SharePoint service application (available only in the Enterprise edition of SQL Server) that allows developers to create integrated dashboards from SQL Server Business Intelligence Databases. The dashboard can link to content from PPS scorecard/grid/chart designers, deployed SSRS reports and deployed Excel pivot table content, and custom Web pages.
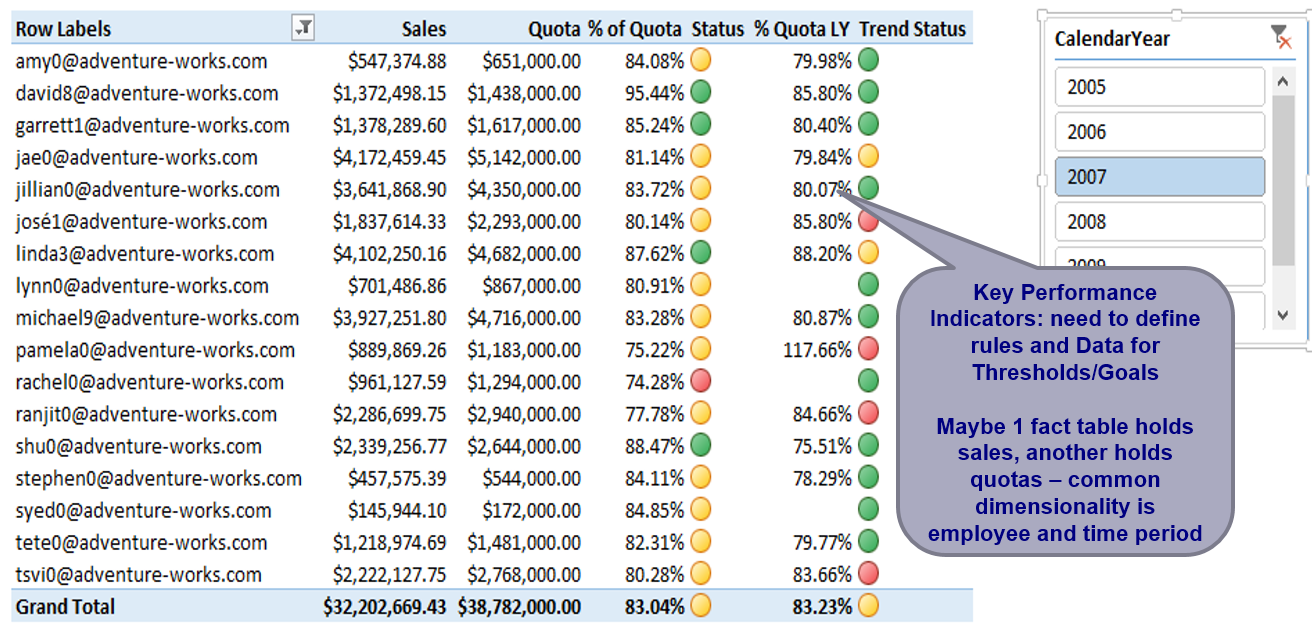
Figure 11 shows an example of a KPI scorecard/pivot table that I created in Excel (against an OLAP database) and then deployed to SharePoint via the Excel Services Service Application in SharePoint. There are two key points here. The first is that developers can deploy (push) Excel content up to a SharePoint document library and then allow users to navigate/interact with the Excel content, similar to a user running a report with different parameters. The second is that developers can create visual KPIs using several different output tools. This goes back to a point I made at the beginning of this article; although the output tools are generally not terribly difficult to learn, the issue can be which tool is the best for a given situation. In other words, if you want to create an output screen/page that renders three KPIs and a chart, should you use Reporting Services, Excel, or SharePoint? Just like with many questions, the answer is usually “it depends.”
Additional Reading: In Table 1, Item #15 references a detailed slide deck on Integrating SSRS with SharePoint. Item #16 references a feature matrix guideline document on when to use SSRS, Excel Services, SharePoint Designers, or custom .NET reporting tools for certain situations. Item #17 references a prior CODE Magazine article on creating dashboard content in PerformancePoint Services.
13: Integrating SQL Server BI Applications with .NET
For years I taught SQL Server DW/BI classes and some .NET classes as well. Sometimes I talked about “when worlds collide,” representing instances where SQL DW/BI developers need to write .NET code to perform special tasks. Some of these tasks might include:
- Writing .NET code using ADOMD.NET to access the metadata of an SSAS OLAP cube
- Accessing a deployed SSRS report from a custom ASP.NET webpage
- Building Custom Data Extensions for SSRS reports
- Writing a C# script inside an SSIS package to execute a deployed SSRS report and render the output as a PDF with no user intervention
These are just four of many scenarios. SharePoint/.NET developers who work with the SQL DW/BI tools could probably list examples as well. In some cases the scenario is where one application needs to communicate with another one. In other cases (such as the third item above, launching an SSRS report inside an SSIS package), it's because SSIS has no built-in component/task to execute an SSRS report.
Listing 4 shows an example of this. It's one I've had to implement for three out of my last four customer applications.
Listing 4: An SSIS Script (in C#) to render an SSRS report to a PDF
public void Main()
{
    // need "using Microsoft.Reporting.WebForms" at top of script
    ReportViewer rViewer = new ReportViewer();
    rViewer.ServerReport.ReportServerUrl =
        new Uri(@"http://kevindellpc/ReportServer_SQL2012");
            // tell the report viewer about the SSRS virtual directory
            // now tell the report about the CalendarYear parameter

    // set SSRS parameters programatically
    // we need to create a .NET LIST of parameters

    List<ReportParameter> ParmList = new List<ReportParameter>();

    // need to add a "using System.Collections.Generic" to the top,

    // take the 2 package variables and place them into
    // local script variables

    string Year = Dts.Variables["YearToRun"].Value.ToString();
    string RequestID = Dts.Variables["RequestID"].Value.ToString();

    ParmList.Add(new ReportParameter("CalendarYear", Year));

    // next, we need to set the path for the report...the report
    // (deployed) folder and the report name
    rViewer.ServerReport.ReportPath =
        "/SSRSReportFolder/rpt13_PerformanceGaugeAndSparkline";

    rViewer.ServerReport.SetParameters(ParmList);
    // you plug the parameters into the report instance
    // we can't do this until AFTER we set the report path


    string mimeType, encoding, extension;
    string[] streamids;
    Warning[] warnings;

    // we use the reportviewer method (function) called Render
    byte[] bytes = rViewer.ServerReport.Render("PDF", null,
                        out mimeType, out encoding, out extension,
                        out streamids, out warnings);

    // at this point...Render returned a stream of bytes into the
    // byte array called bytes

    // how do we create a PDF out of it?  An actual file name?
    // we can create a .NET file stream....we need to refer to
    // "using System.IO"

    using
        (FileStream stream = File.Create(@"C:\ReportOutput\Test" +
                                                    RequestID + ".PDF"))
    {
        stream.Write(bytes, 0, bytes.Length);
    }

    Dts.TaskResult = (int)ScriptResults.Success;
}
- Create an instance of the Reporting Services viewer from the
Reporting.Webformsnamespace. You might be wondering “Wait a minute, this job is supposed to auto-export an SSRS report inside an SSIS package, unattended. Why would you create an instance of an SSRS viewer?” As it turns out, the SSRSViewerobject model provides methods to render SSRS output unattended! - Set the viewer's
ReportServerUrlproperty to a new instance of a URI that corresponds to the SSRS Virtual Directory definition on the SSRS server that contains the SSRS report. - Create a new List of type ReportParameter from the
Reporting.Webformsnamespace and add new ReportParmeter defintions for each of the parameters in the SSRS report. - Set the Viewer's
ReportPathproperty to the SSRS folder name plus the SSRS report name (do not include the “.RDL” extension). - Call the viewer's
SetParametersmethod and pass the Parameter list that you created above. - Call the viewer's
RenderMethod, passing the render (export) format, such as PDF, Excel, MHTML, etc. - Note that
RenderMethoddoes not itself generate a PDF. It's a generic method that returns an array of bytes. You need to create a FileStream usingFile.Create(), from theSystem.IOnamespace, and write out the array of bytes to the FileStream.
The Next Installment of Baker's Dozen
In this Baker's Dozen article, I've given a State of the Union for the SQL DW/BI stack that applies to SQL Server application developers. In the next article, I'll give another State of the Union address to a relatively new area, one where Microsoft has been focusing considerable attention: the Cloud (Azure) and Self-Service BI area. I'll cover what Self-Service BI means, where it intersects with the concepts in this article for developers, and Microsoft's new offerings in the cloud. Stay tuned!
Table 1: The links referenced in this article
| # | Webcast link | Slide deck/article link | Category | Description |
| 1 | General DW | PASS Webcast in late December 2014 on Data Warehousing | ||
| 2 | CDC | Special Baker's Dozen webcast, 13 tips for Change Data Capture (1/15/2014 recording) | ||
| 3 | ColumnStore | Special Baker's Dozen slide deck, 13 tips for Columnstore Index | ||
| 4 | In-Memory Optimized | Special Baker's Dozen slide deck, 13 tips for In-Memory Optimized Databases in SQL Server 2014 | ||
| 5 | SSIS | A series of training videos to get started with SSIS | ||
| 6 | SSIS | CODE Magazine Baker's Dozen articles on SSIS (July/August 2010 and September/October 2010 editions) | ||
| 7 | SSAS MOLAP | A series of training videos to get started with SSAS MOLAP | ||
| 8 | SSAS MOLAP | CODE Magazine Baker's Dozen article on building SSAS OLAP Cube (March/April 2011) | ||
| 9 | SSAS MOLAP | Special Baker's Dozen webcast, 13 steps for building an SSAS OLAP database (3/10/2013 recording, a six part video) | ||
| 10 | SSAS Tabular | CODE Magazine Baker's Dozen article on SSAS Tabular (January/February 2013) | ||
| 11 | MDX | A series of training videos on different SSAS MDX topics | ||
| 12 | MDX | CODE Magazine Baker's Dozen article on getting started with MDX code (January/February 2008) | ||
| 13 | SSRS | A large four-part video to recreate entire report/performance gauge chart in Figure 8) | ||
| 14 | SSRS | A step-by-step guide for implementing Data Driven Subscriptions in Reporting Services | ||
| 15 | SharePoint w/SSRS | Special Baker's Dozen slide deck, 13 tips for integrating SSRS with SharePoint | ||
| 16 | General Output | A feature matrix for SSRS, PerformancePoint Services, Excel Services, and guidelines for which tool is best for certain output scenarios | ||
| 17 | SharePoint w/PPS | CODE Magazine Baker's Dozen article on creating SharePoint PerformancePoint Services dashboards (March/April 2008) |