


We’ve all heard that version 3 of a Microsoft product is when that product really hits its stride. And while I’m not sure of the truth of that software urban legend, I do have to say that Microsoft, with the release of SQL Server 2008 Reporting Services (which happens to be its 3rd major version), has released a gem of a reporting solution that is sure to please users of prior versions and bring more converts into the Reporting Services fold. The newest version of SQL Server Reporting Services is faster, can handle larger reports, supports a wider variety of browsers, and is more flexible thanks to the new Tablix data region, support for rich text content, and Microsoft Word as an output format.
One of the biggest, yet mostly invisible, changes Microsoft has made to SQL Server Reporting Services (SSRS) for SQL Server 2008 is that it has decided to ditch Internet Information Services (IIS). SSRS now runs directly on top of HTTP.SYS server API, completely bypassing IIS. This means that SSRS no longer has to worry about other IIS applications impacting reporting performance. And by making this change, as well as the move to an on-demand report processing engine, Microsoft made significant speed and scalability improvements to the SSRS engine. SSRS can now execute much larger reports and execute them faster as well. For installations where SSRS must coexist on a server alongside of IIS, SSRS and IIS do not conflict. However, when run under Windows XP alongside of IIS, reporting services cannot be hosted on port 80. (The suggested port 8080 works just fine, though.)
Microsoft made virtually no changes to security in SSRS: NTLM, Kerberos, Negotiate, Basic, and Custom protocols are supported as before. If you need to make changes to authentication, for example, to allow basic authentication (which is disabled, by default), you need to modify the RSReportServer.config file rather than use the IIS MMC snap-in tool since SSRS no longer runs on IIS.
I was dismayed to find that Reporting Services still doesn’t support a form-based security model out of the box. Ideally, I’d like to see a future version of SSRS offer a mixed security model, much like SQL Server’s database engine offers. It’s worth noting, however, that such a model is supported if you configure Reporting Services to work in SharePoint Integrated mode, but that’s a big and potentially expensive commitment that many installations (including the one I manage for my organization) are not willing to make.
Nothing much has changed in terms of the SSRS Web Service API. In fact, the namespace is still RS2005 (RS2006 if you are using Reporting Services in SharePoint Integrated mode). Microsoft retired the RS2000 namespace, however, so if you still have apps using that older endpoint and you wish to take advantage of SSRS 2008, you will need to rework your code.
Report Rendering
One of my favorite improvements to SSRS is hardly mentioned by Microsoft but I know it will be very exciting for organizations like mine that need to support multiple browsers and platforms: the HTML rendered by Reporting Services renders nicely in most major browsers, including Internet Explorer, Firefox, Chrome, Opera, and Safari.
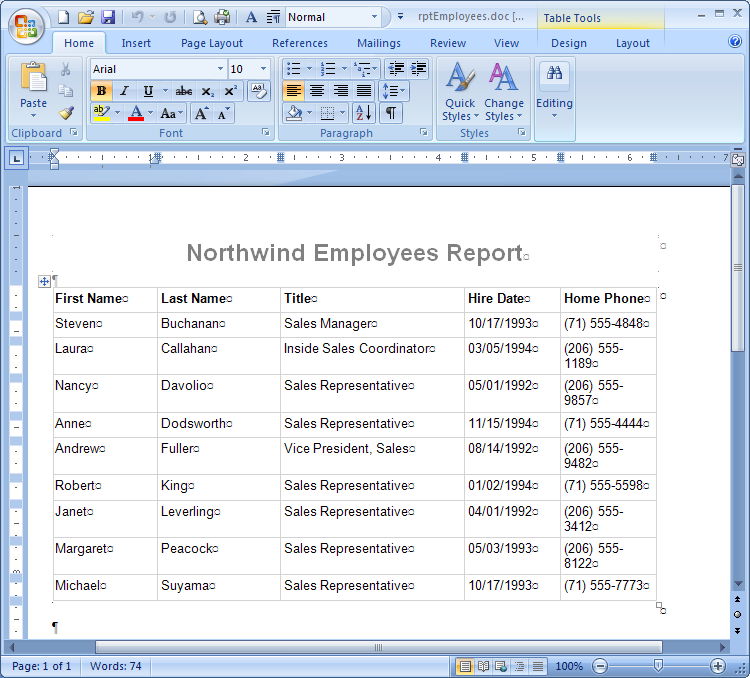
Speaking of rendering, Microsoft made a number of other improvements in this area too, including improved output to Excel and Text formats. For Excel, SSRS now supports subreports and nested data regions. For CSV (text), you can now opt for Excel or CSV-compliant modes. However, the big story here is the newfound support for the Microsoft Word format. SSRS can now render any report to the Word .DOC (not .DOCX) format, which is supported by Microsoft Word versions 2000-2007. See Figure 1 for an example of a report rendered to Word.
One thing that hasn’t changed much with SSRS 2008 is Report Manager. This very capable browser-based tool for managing your Report Server reports is much the same as before. Its sibling, however, the SQL Server Management Studio-based Report Manager that was introduced with SSRS 2005, has been discontinued, which is no big deal since hardly anybody bothered to use it.
The HTML rendered by Reporting Services renders nicely in most major browsers, including Internet Explorer, Firefox, Chrome, Opera, and Safari.
Report Designer Improvements
The Visual Studio-hosted report designer has gotten a significant makeover in this version. Prior versions of Reporting Services had three views: Data, Layout, and Preview. SSRS 2008, however, has moved data manipulation to the Report Data pane and replaced the three views with two: Design and Preview. You can see the new designer in Figure 2. Notice the Report Data pane on the left and the grouping pane at the bottom center of the design surface.
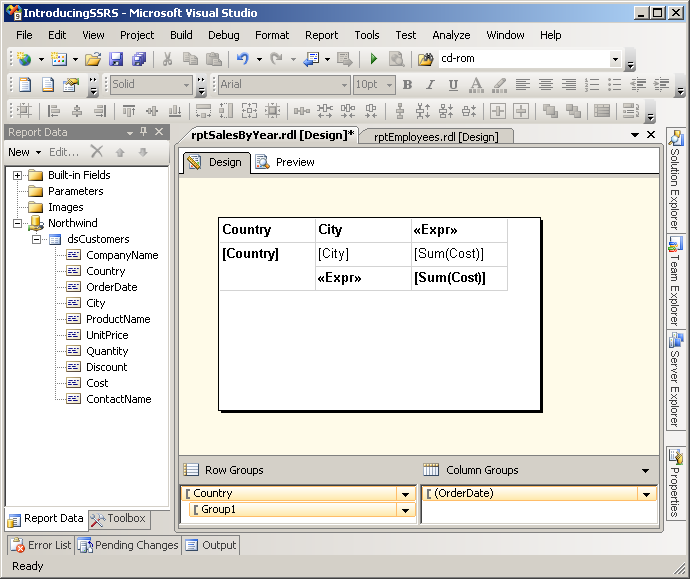
The best thing about the Report Data pane is that report parameters and built-in fields such as page number are now surfaced right there above the dataset fields as you can see in Figure 2. On the negative side, I find Reporting Services 2008’s insistence that I create a named data source just to point to an existing data source a real unnecessary annoyance.
Microsoft has improved many of the dialogs in SSRS 2008. One of the best examples is the Report Properties dialog, which finally allows you to directly select page orientation rather than force you to swap the height and width values when switching from portrait to landscape.
The New Tablix Data Region
Microsoft has replaced the separate table, matrix, and list data regions with a single unified region: Tablix. But if you look for Tablix on the Report Items tab of the Visual Studio 2008 Toolbox you’ll be surprised to find it’s not there. Rather, you will still find separate items for table, matrix, and list. In reality, Tablix is there behind all of those regions but Microsoft thought it would be better to give you starter “views” of the Tablix region rather than have a single Tablix region with a very complicated user interface.
So why did Microsoft introduce Tablix? One word: flexibility. Previously, when you crafted a report you were forced to choose a tabular, matrix, or list report. With SSRS 2008, you do the same, but the difference is that you can take a tabular report and add a column (dynamic crosstab-style) group. Or perhaps, start with a matrix report and add a static column to the left or right of a column group. The possibilities are endless.
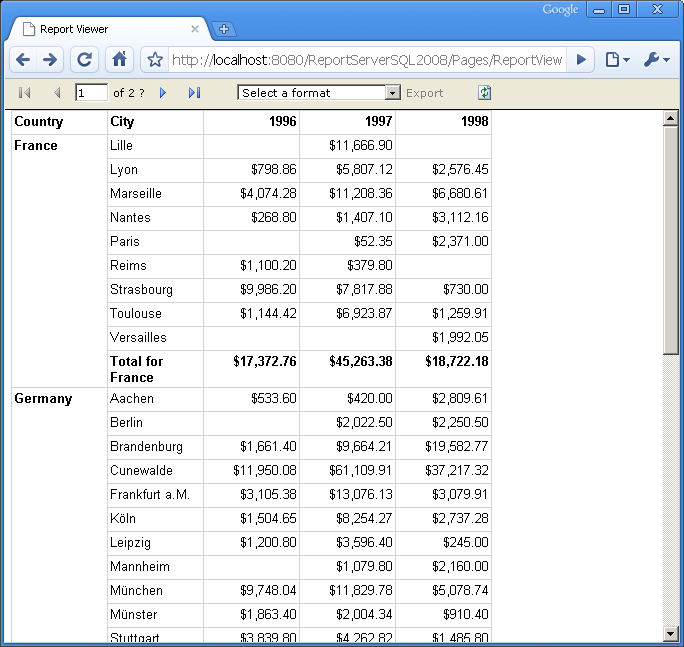
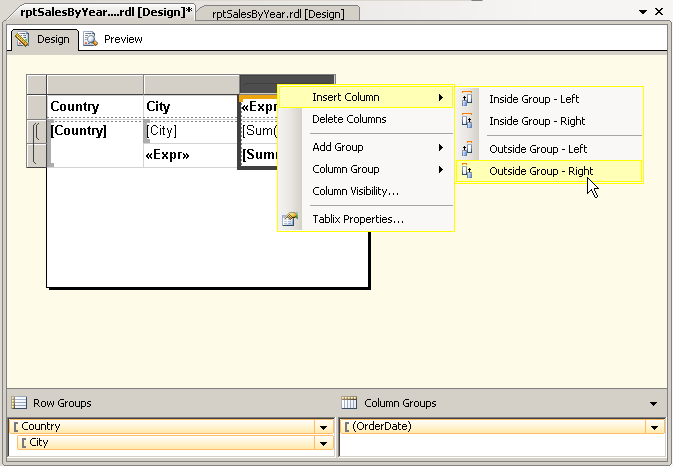
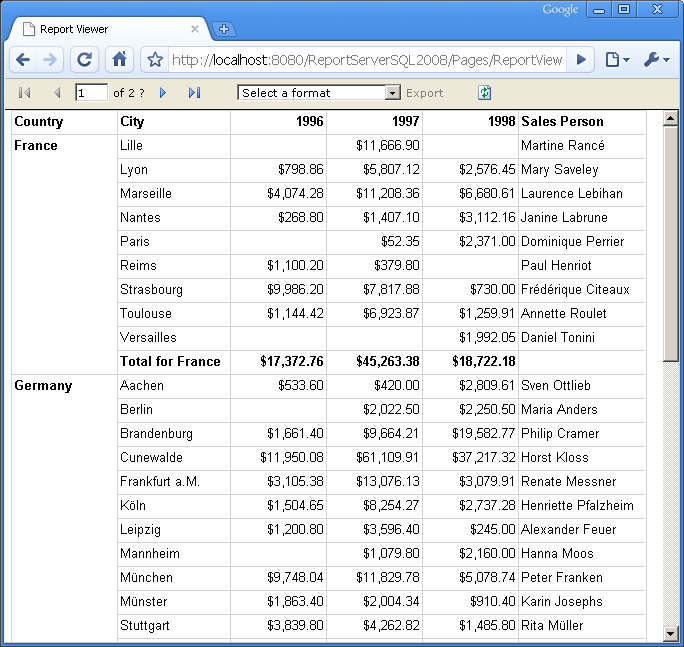
For example, let’s say you start with a matrix report as shown in Figure 3. You could have created this report, rptSalesByYear, in SSRS 2005. It has two row groups: Country and City and one column (dynamic) group Year and displays the sum of sales in each cell of the matrix. But let’s say you wanted to display to the right of the year columns the salesperson assigned to that city. This would be impossible in SSRS 2005 but in Reporting Services 2008, it’s a snap. From Design view, right-click on the Year column selector and select Insert Column|Outside Group-Right from the popup menu as shown in Figure 4. Next, drag the SalesPerson field from the Report Data pane to the new empty column to the right of the Sum(Cost) column and you have now created a hybrid data region that has attributes of matrix and tabular reports as shown in Figure 5. Tablix reports also support displaying more than one column group in a report and a number of other variations of the Matrix, Table, and List data regions.
In theory, the Tablix offers you infinite flexibility and this is, of course, good. In practice, however, there are a few kinks. Doing simple things, for example, like making the table header repeat at the top of every page of a tabular report, is too complicated. I needed to read a blog post just to figure out how to accomplish this. The solution is to click on the little arrow to the right of “Column Groups” in the grouping pane (look at the bottom right of Figure 2) and select Advanced Mode. This changes the grouping pane to show normally hidden static groups. Select the top group under Row groups and then use the Property window to set its RepeatOnNewPage property to True. Wow, that’s a lot of non-obvious steps for a fairly commonly needed feature.
Rich Text Support
Reporting Services textbox control now supports rich text formatting. This means that a textbox can include a paragraph of text, for example, that formats each word-even each character-differently. This fact combined with SSRS’ support for Word as an output format means that Reporting Services is now a great choice for producing server-based mail-merge type documents without any need to write Microsoft Word automation code.
Before you can use the new rich text feature, you need to understand that textboxes in SSRS 2008 work in two basic modes. By default, rich text support is off and the textboxes support standard formulas or static text just like prior versions. For example, a textbox might have its expression set to:
=Fields!CompanyName.Value
But SSRS 2008 textboxes can also operate in placeholder mode. When in placeholder mode, you add placeholders and text “in place” rather than using the Expression dialog box. Converting a textbox to this new mode requires a little keyboard gymnastics. Click on a textbox, click on it a second time to select its contents, and right-click and select Create Placeholder… from the popup menu. If the popup menu doesn’t include the Create Placeholder… menu item, then you will have to close it and try again.
This multiple popup menu situation was always a pet peeve with past versions of SSRS; with the introduction of yet another popup to support placeholders in the new version, the situation is worse. I would prefer that Microsoft stop the proliferation of popups and move to a single integrated popup menu for future SSRS versions. In addition, it would be nice if the popup menu let you toggle between expression mode vs. placeholder mode rather than the current confusing situation.
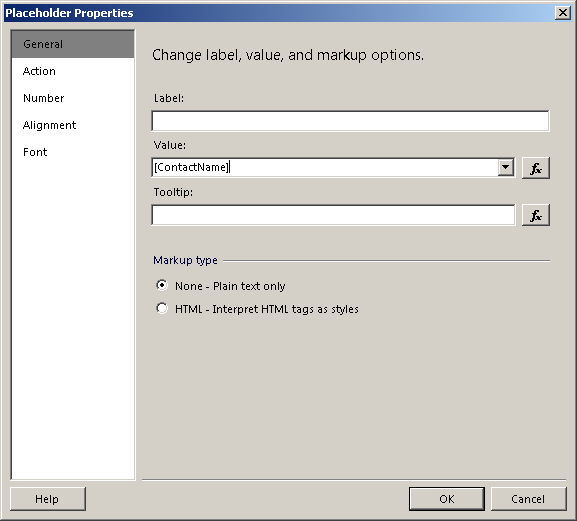
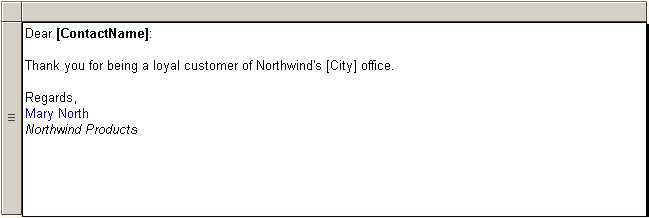
If you can get past the confusing user interface, when you select Create Placeholder… for the first time, SSRS opens the Placeholder Properties dialog box, as shown in Figure 6. You can skip the optional Label box in this dialog (which is not the same thing as the textbox’s name), and select a field from the Value dropdown as shown in Figure 6. When you click OK and return to the design surface, you can now reposition the cursor within the textbox and type any static text you’d like. When you are ready for another field, right-click and select Create Placeholder… again from the popup menu to add another “merge” field. Note that you can individually format spans of text when in placeholder mode. For example, Figure 7 demonstrates what a textbox in this rich text mode looks like when nestled within a List data region.
Now imagine using the rich text support in SSRS to replace all of your desktop-based mail-merge solutions. In fact, when combined with SSRS support for scheduled subscriptions and the Word output format, one can easily envision a mail-merge operation that runs in the middle of the night and e-mails the “merged” documents to users or drops the documents in a network share folder. The only thing left to do is to print the documents!
Personally, I don’t see a heck of a lot of value in the addition of gauges to SSRS, but those who enjoy USA Today-style charts and believe they convey additional information will surely appreciate them.
SSRS provides an alternate way to work with rich text within its textboxes. Notice the Markup type radio buttons in the Placeholder Properties dialog (see Figure 6). By selecting “HTML - Interpret HTML tags as styles” and embedding HTML formatting tags within a field’s value, you can pump pre-formatted text into a rich text-enabled textbox to get the same effect as the multiple placeholders. For example, a report based on a dataset created by the following SQL and with its Markup type set to HTML will generate the same merge text as the textbox from Figure 7:
SELECT 'Dear <b>' + ContactName +
'</b>:<br/><br/>Thank you for being a loyal
customer of Northwind''s ' + City + '
office.<br/><br/>Regards,<br/><span
style="color:blue">Mary
North</span><br/><i>Northwind Products</i>'
AS MailMergeText
FROM Customers
New Charts and Gauges
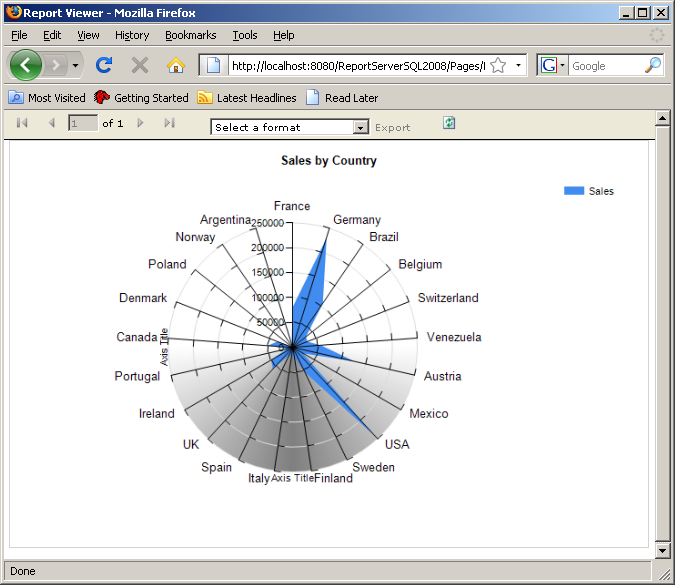
When Microsoft introduced SQL Server 2000 Reporting Services in 2002, Microsoft decided to license the Dundas charting product for its Chart data region. Prior to the release of SSRS 2008, however, Microsoft bought the Dundas charting tool outright, presumably so it could get complete product development control over SSRS charts and leverage SSRS charts in other products like ASP.NET. The first version of SSRS charts since the purchase shows this effort was well worth it. The designer support for charts is much more intuitive than prior versions. The new designer support allows you to directly edit most properties such as axes and titles without having to jump into modal dialog boxes. Other improvements include support for multiple axes, axis break, error bars, and custom palettes. A number of new chart types are also supported by the new release including stepped line, polar, Gantt, funnel, pyramid, histogram, and box charts. Figure 8 illustrates the use of a polar chart to display Northwind sales figures by country.
Reporting Services now supports a new type of data region: the gauge. Gauge support, which is also sometimes termed data visualization, allows you to place a gauge on a report to display a single scalar value using a picture. Personally, I don’t see a heck of a lot of value in the addition of gauges to SSRS, but those who enjoy USA Today-style charts and believe they convey additional information will surely appreciate them.
Report Builder Update
If you call up Report Builder from the browser-based Report Manager, you may be surprised to find that Report Builder 1.0 appears. You need to download the updated Report Builder, version 2.0, separately from the msdn.microsoft.com Web site. Just search Google or Bing for “Report Builder 2.0” and you should easily find the page from where you can download it.
For those unfamiliar with Report Builder, it is an ad-hoc query tool that power users can use to build reports. Report Builder 1.0, part of SSRS 2005, allowed power users to build a subset of the reports that a developer/IT professional could build in Visual Studio or SQL Server Business Intelligence Development Studio (BIDS). Power users could only build reports after a developer/IT professional took the time to build a report model (using a Visual Studio/BIDS Report Model project) that simplified the power user’s view of the database. Report Builder 2.0 improves the ad-hoc reporting landscape on two major fronts. First, Report Builder users can now access Reporting Services data sources directly, without the need for a report model. (Keep in mind, however, that you still can create report models, and in many cases, this is still a wise thing to do unless your database is incredibly simple or your power users are incredibly sophisticated.) Second, Report Builder can now create and edit any report that was created with Visual Studio or BIDS.
Added support for rich text and Microsoft Word may mean you can finally retire all that fragile desktop Word mail-merge code and replace it with a true server-based mail-merge system.
I like the direction that Report Builder is taking in this release. However, it’s worth noting that there is a cost for this extra power and flexibility, namely complexity. Power users may be put off by the need to navigate a much more complicated user interface with Report Builder 2.0. Furthermore, it appears that Microsoft may have rushed the Report Builder Wizard out the door before it was quite ready. Although it claims to support both table and matrix style reports, the Wizard is designed more for the matrix report and forces you to choose an aggregate function for any numeric values on the detail section of your tabular report. This is just bound to confuse the heck out of power users; I know it confused me! Fortunately, you can still use Report Builder 1.0 against SSRS 2008 for those situations where you’d prefer to present a simpler user interface to your power users. That said, the advanced power user will undoubtedly appreciate Report Builder 2.0, even with its added complexity.
Conclusion
SQL Server 2008 Reporting Services is a significant update to Microsoft’s reporting platform that mostly hits its mark. Major changes include a re-architecture of the reporting engine to maximize performance and scalability and the introduction of the Tablix data region that makes previously impossible matrix/table hybrid reports now easily achievable. Added support for rich text and Microsoft Word may mean you can finally retire all that fragile desktop Word mail-merge code and replace it with a true server-based mail-merge system. SSRS 2008 also improves its charting capabilities and adds data visualization via gauges. Perhaps best of all, Reporting Services now provides excellent rendering fidelity in most major browsers, including Firefox, Chrome, Opera, and Safari, in addition to its requisite support for Internet Explorer.
Not all is smooth for the new version, however: I found some rough edges with the Report Data pane, Tablix data region, and the retooled Report Builder 2.0. Still, these issues are pretty minor compared against the major productivity improvements that Reporting Services 2008 brings to the table. In short, if you currently use a prior version of SSRS, the decision to upgrade your report server is a no-brainer: do it as soon as possible.