


SQL Server Reporting Services versions 2000 and 2005 (SSRS) has many powerful features. SSRS has a well-designed data access engine, a great set of layout tools, and an excellent expression system for creating complex formulas. While the expression system is quite powerful it is not suitable for all applications. This is where SSRS shines. SSRS gives developers the ability to add custom code to their report layouts. This article demonstrates adding custom code to SQL Server Reporting Services reports.
Creating the Sample Report
This article uses data from the SQL Server sample database Northwind. To create new reports, you’ll perform the following tasks.
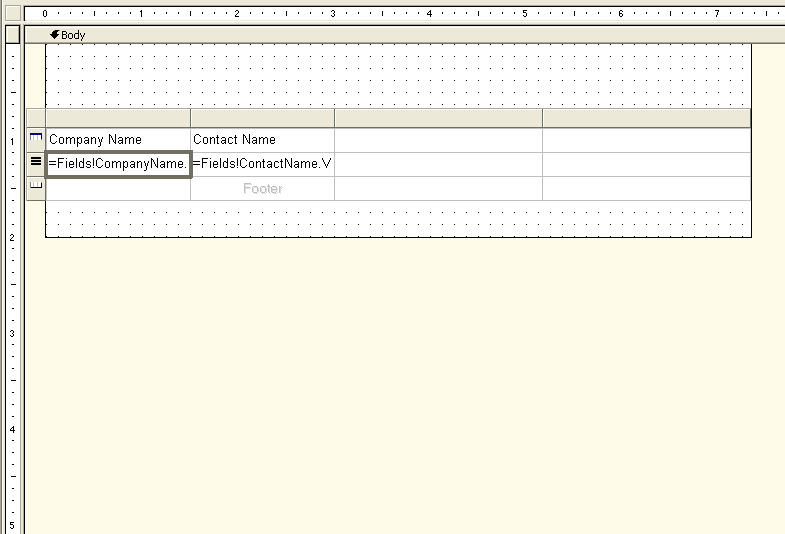
Now create a report layout.
Adding Custom Code to a Report
Now that you have created a simple report you can add custom code. SSRS provides two mechanisms for adding code to your report: You can embed Visual Basic .NET code directly in your reports or you can add externally created and compiled assemblies.
Embedding VB.NET Code
SSRS provides the capability of embedding Visual Basic .NET code directly within report layouts. Embed code into reports by selecting Report | Report Properties… from the Visual Studio shell, and then select the Code tab in the provided dialog box. Enter the following code into the Custom Code field and click OK:
Function CoDeDemo_()
 (ByVal cField As String) As String
        Return cField.ToUpper()
    End Function
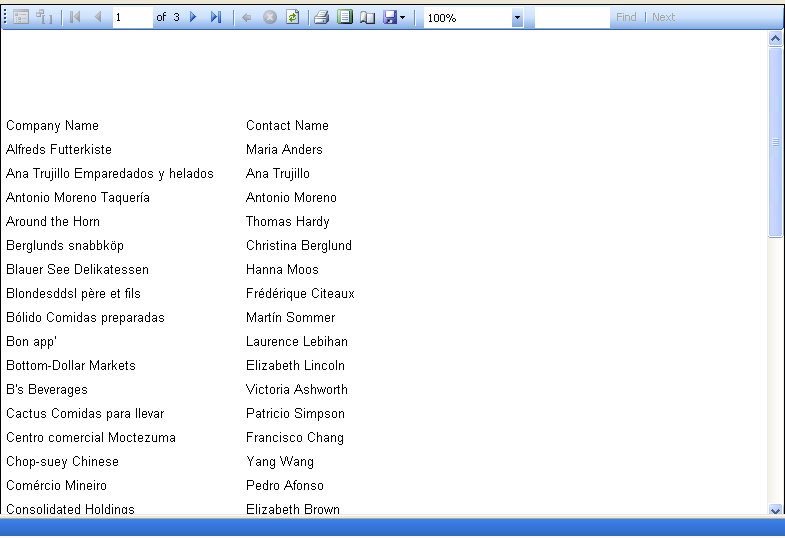
You can call your new function from your report by using the Code function provided via the SSRS expression syntax. To use your new function, switch to the Layout tab in the Report Designer. In the Company Name field, change the Value property from =Fields!CompanyName.Value to =Code.CoDeDemo(Fields!CompanyName.Value). Now select the Preview tab. The output for the CompanyName displays in upper case.
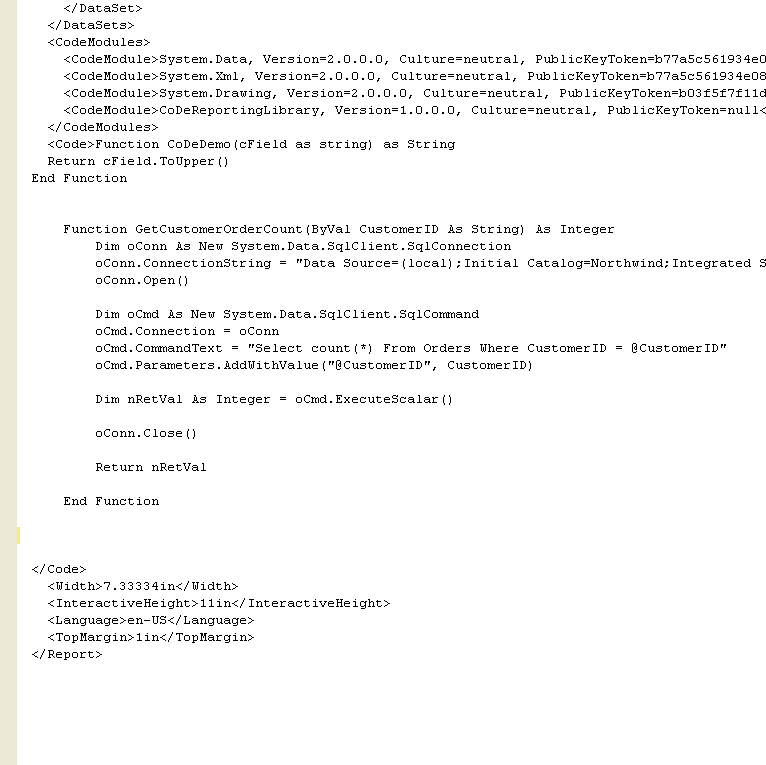
If you don’t like editing code using small dialog boxes, you have another mechanism for editing embedded report code. In the Solution Explorer, right-click the report and select View Code from the provided pop-up menu. Search for the <Code> element in the provided XML source code (Figure 3). You can type or paste code directly into the XML file.
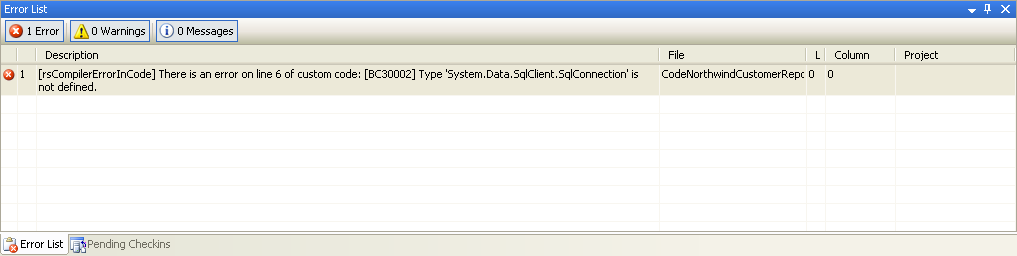
By default the SSRS custom code mechanism is limited to the most basic functions of the .NET Framework. To add more advanced capabilities (data access for instance) you must add references to the desired assemblies. The code in Listing 1 demonstrates accessing data from SQL Server and returning it to the report. After adding the code from Listing 1 to the report you can test it by adding a new column to the report. From the Layout tab add a new column and set its Value property to =Code.GetCustomerOrderCount(Fields!CustomerID.Value). When you select the Preview tab you see a compilation error in the Error List tab of the Visual Studio designer (Figure 4). This signifies that a reference to the assembly containing the System.Data.SqlClient.SqlConnection class is missing. To fix this issue you need to add references to the System.Data and System.XML assemblies.
To add a reference to your report, open the Report Properties dialog box from the Visual Studio Designer and select the References tab. Click the ellipsis button. This opens an Add Reference dialog box. Select the System.Data and the System.Xml assemblies from the provided dialog box. Previewing your report should now show the number of orders for each customer record.
Adding Custom Assemblies
As explained earlier, SSRS provides the ability to add code to your reports using two mechanisms: direct embedding of Visual Basic code or linking to external assemblies. This section discusses creating an external assembly and using it in your reports. Why would you want to create an external assembly for your reports? Two reasons come to mind. The first reason is reuse. You can use external assemblies in multiple reports. You cannot access embedded code from multiple reports. The second reason is that you might prefer writing code in C#, C++, or some other .NET language. As stated earlier, SSRS embedded code is limited to using only Visual Basic code.
So how do you create and embed your own assembly into an SSRS report? It’s pretty simple. The first step is to create a new class library with a shared method (static for C# folks). To create the class library for this example, do the following:
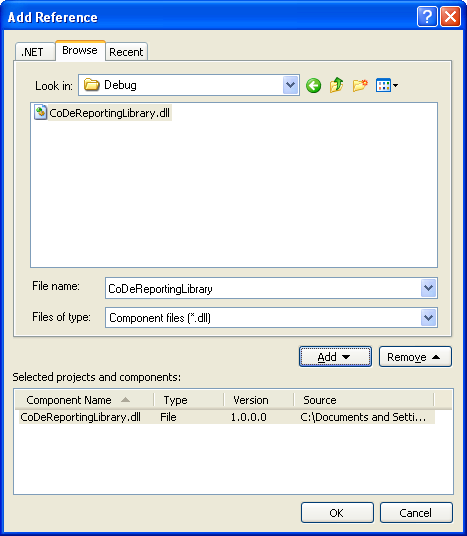
The next step is to add a reference to your new assembly to your report. Open the Report Properties dialog box from the Visual Studio Designer and select the References tab. Click the ellipsis button. This opens an Add Reference dialog box. This time select the Browse tab and navigate to your custom assembly (Figure 5). You can now call functions from this library by specifying the property syntax for your shared function in the Value property of a text box. To call a function from an external library, specify the fully delimited syntax for the class; that is, provide the Namespace, Class, and Function name. For this example the value property is given below:
=CoDeReportingLibrary._
CodeReportingFunctions._
GetCustomerOrderCount _
(Fields!CustomerID.Value.ToString())
Once you have specified the proper syntax for calling your library you can preview your report. You will immediately receive an error stating that the CodeReportingLibrary class is not found. This error occurs because the Report Designer looks in a specific directory for your assemblies. Take the DLL you created and copy it to the following directory:
 C:\Program Files
\Microsoft Visual Studio
8\Common7\IDE\PrivateAssemblies
Now you can preview the report. The results provided by your report extension are visible on the report output.
Deploying Custom Assemblies
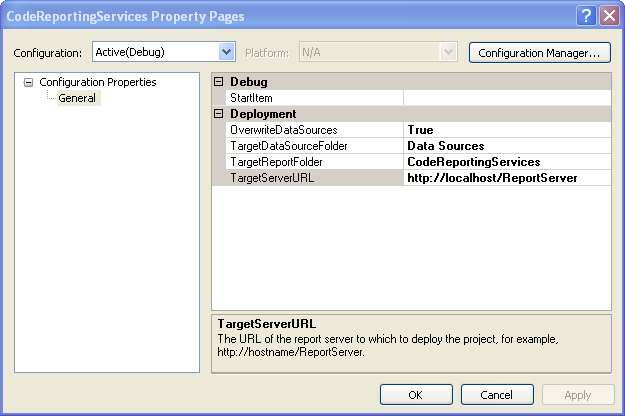
Once you have created your report, you now need to deploy it to your report server. The first step to deploying a project is to specify the Web server location for your SSRS installation. To specify the location for your Web server, right-click the reporting project in the Solutions Explorer and select Properties from the pop-up menu. Specify the location of your Web server in the TargetServerUrl field (Figure 6) and save your changes by clicking OK. Now you can deploy your report by right-clicking again and selecting Deploy from the pop-up menu. The first time you deploy the report you will receive an error informing you that your custom assembly is missing from the reporting server. Copy your DLL to the following directory:
C:\Program Files\Microsoft SQL
Server\MSSQL.3\Reporting
Services\ReportServer\bin
Deploying your report should succeed this time. But there is another problem. If you attempt to run your report you will see an error value where the number of orders should be. So what is the problem now? SSRS does not trust your assembly to execute code from the System.Data.SqlClient assembly. How do you fix this? You need to add some XML to the security policy file for SSRS. To change the SSRS security policy, navigate to the C:\Program Files\Microsoft SQL Server\MSSQL.3\Reporting Services\ReportServer directory and open the rssrvpolicy.config file. This file contains the security settings that SSRS uses to protect itself from rogue code. Search for the value $CodeGen$. Add the code in Listing 4 after that code group’s ending element.
After adding configuration information for your assembly you need to do one more thing. Your method code needs to assert the proper permissions. The permission to assert is the SqlClientPermission. The first step is to import the System.Security.Permissions assembly into your class. After importing this assembly, add the following code at the beginning of your method:
SqlClientPermission oPerm = new
  SqlClientPermission(
PermissionState.Unrestricted);
oPerm.Assert();
In Visual Basic add the following code:
Dim oPerm As New _
  SqlClientPermission(_
PermissionState.Unrestricted)
oPerm.assert()
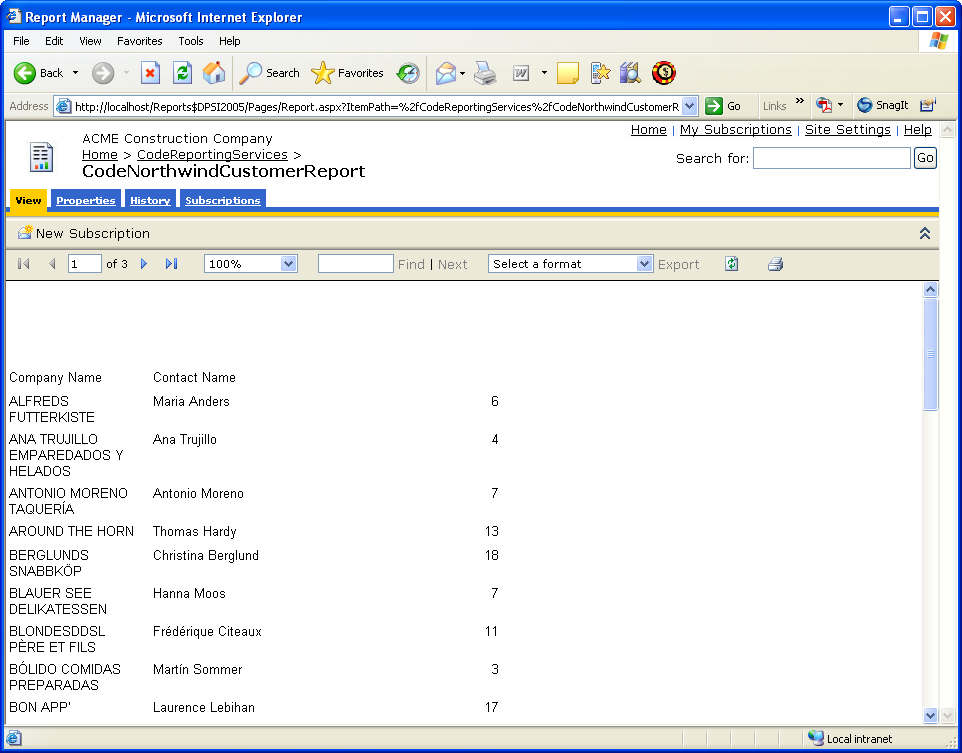
This code tells the CLR that this assembly can run code from the SqlClient class library. Now you can test your report in the SSRS report manager. Figure 7 shows the contents of your deployed report in the SSRS Report Manager.
Conclusion
Adding .NET code to a SQL Server Reporting Services application is not difficult. You can extend SSRS applications in virtually infinite ways using these mechanisms.
Listing 1: Custom code for retrieving customer order counts
Function GetCustomerOrderCount(ByVal CustomerID As
String) As Integer
 Dim oConn As New System.Data.SqlClient.SqlConnection
 oConn.ConnectionString = _
 "Data Source=(local);
  Initial Catalog=Northwind;
  Integrated
  Security=SSPI"
  oConn.Open()

 Dim oCmd As New System.Data.SqlClient.SqlCommand
 oCmd.Connection = oConn
 oCmd.CommandText = _
 "Select count(*)
   From Orders Where
   CustomerID = @CustomerID"
 oCmd.Parameters.AddWithValue_
  ("@CustomerID", CustomerID)

 Dim nRetVal As Integer = oCmd.ExecuteScalar()
 oConn.Close()

 Return nRetVal

End Function
Listing 2: Visual Basic shared function for querying data in a custom report extension
Imports System.Security.Permissions
Imports System.Data.SqlClient

Public Class CodeReportingFunctions

Public Shared Function GetCustomerOrderCount(ByVal _
   CustomerID As String) As Integer

  Dim oPerm As New _
  SqlClientPermission(_
  PermissionState.Unrestricted)
  oPerm.assert()

  Dim oConn As New System.Data.SqlClient.SqlConnection
  oConn.ConnectionString = _
     "Data Source=(local);
     Initial Catalog=Northwind;User
     Id=<<USER>>Password=<<PASSWORD>>"
   oConn.Open()

   Dim oCmd As New System.Data.SqlClient.SqlCommand
   oCmd.Connection = oConn
   oCmd.CommandText _
      = "Select count(*)
         From Orders
         Where CustomerID = @CustomerID"
   oCmd.Parameters._     AddWithValue("@CustomerID", CustomerID)

   Dim nRetVal As Integer = oCmd.ExecuteScalar()

   oConn.Close()
   Return nRetVal
 End Function
End Class
Listing 3: C# static function for querying data in a custom report extension
using System;
using System.Security;
using System.Security.Permissions ;
using System.Data.SqlClient;
using System.Collections.Generic;
using System.Text;

namespace CoDeReportingLibrary
{
public class CodeReportingFunctions
{
  public static int GetCustomerOrderCount(string
  CustomerID)
  {
  System.Data.SqlClient.SqlClientPermission
  oPerm =  new System.Data....
  SqlClientPermission(PermissionState.Unrestricted);
 oPerm.Assert();

 SqlConnection oConn = new SqlConnection();
 oConn.ConnectionString
  = "Data Source=(local);
     Initial Catalog=Northwind
     ;User Id=<<USER>>;Password=<<PASSWORD>>";

 oConn.Open();
 SqlCommand oCmd = new SqlCommand();
 oCmd.Connection = oConn;
 oCmd.CommandText =
   "Select count(*)
      From Orders
     Where CustomerID = @CustomerID";
 oCmd.Parameters.AddWithValue(
   "@CustomerID", CustomerID);

 int nRetVal = (int)oCmd.ExecuteScalar();
 oConn.Close();
 return nRetVal;
    }
  }
}
Listing 4: SSRS config file code
<CodeGroup
        class="UnionCodeGroup"
        version="1"
        PermissionSetName="FullTrust"
        Name="CoDeMagSample"
        Description="CoDe Magazine Sample. ">
       <IMembershipCondition
            class="UrlMembershipCondition"
            version="1"
            Url="C:\Program Files\Microsoft SQL
            Server\MSSQL.3\Reporting
            Services\ReportServer\bin\
            CoDeReportingLibrary.dll"
    />
</CodeGroup>