


Using GDI+ in ASP.NET Web Applications, Part 2
In the last issue, I investigated GDI+ and how to use it for image manipulation in Web applications.
This time around, I will look at the generation of brand new images using the same GDI+ technology and features.
Last issue's article, “Using GDI+ in ASP.NET Web Applications, Part 1.” (found at www.code-magazine.com), introduced basic concepts for generating images dynamically to use on Web pages. Keep in mind that the fundamental steps include: generation of in-memory Bitmap objects, drawing using the GDI+ API, and streaming the binary result back to the client (browser) using the ASP.NET OutputStream object.
The techniques demonstrated in this second article are very similar. The main difference lies in the in-memory Bitmap on which you will draw. Although in the previous article you started out with an existing image, in this article I'll show you how to draw on a completely blank image, generated from scratch.
A Text Example
To start out I'll show you how to generate text output.
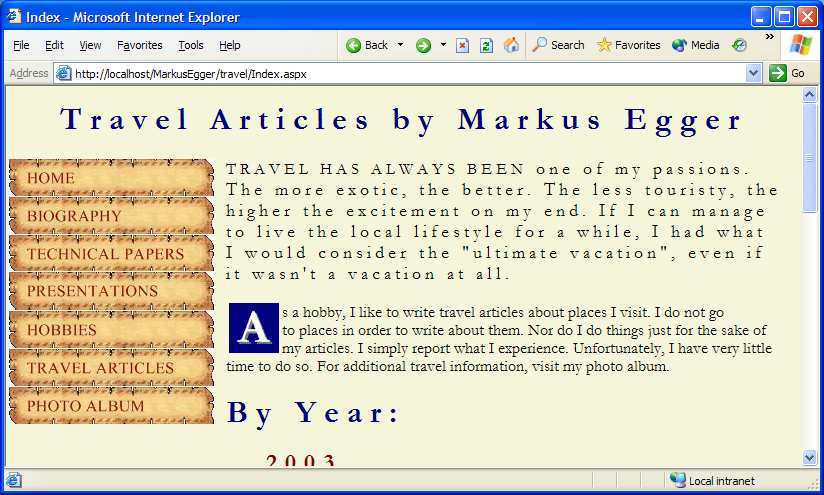
One task that is generally tricky on Web pages (especially in a browser-neutral environment) is displaying drop caps (see Figure 1 for an example, and the sidebar called “Drop Caps” for more information). This is a very widely used technique in other publishing environments, but in HTML, there is no native way to produce them. For this reason, most Web sites that use drop caps generate (static) images for the utilized letters. Using GDI+ you can make this task straightforward and dynamic.
To begin this example, start by creating a new ASP.NET Web page. Call it DropCap.aspx. Remove all HTML from the page with the exception of the very first line that links the aspx file to the code-behind file. Then, add the code shown in Listing 1 to the code-behind file. (For more details about creating this aspx file, please refer to Part 1 of this series.)
When rendering drop caps, one of the fundamental questions you must decide is, “How large do you want to make the image that represents the character?” In this example, you want to be able to pass the character that is to be rendered as a URL parameter. For this reason, the only choice you have is to determine the required dimensions on the fly. To do so, you first retrieve the URL parameter using the QueryString() method. Then, you determine the size of the character string using the MeasureString() method of the Graphics object. This method takes two parameters: The string that you want to measure, as well as a Font object that defines the desired font style and size.
Note that in order to perform this operation, you need to retrieve a Graphics object from some source. This is a bit of a problem, as you cannot just instantiate this type of object. Instead, you need to retrieve it from the rendering canvas (the “output” object). Before you can generate that canvas object (an in-memory Bitmap), you need to know how large it is. It's a chicken-and-egg situation. The easiest way to break this vicious cycle is to create a dummy Bitmap object, and then retrieve the Graphics object from there using the FromImage() method. Voil�, you are ready to measure the size of the drop cap!
The MeasureFont() method returns a SizeF object. This object has two properties you are interested in: The height and the width. Note that you are not just retrieving these values and accepting them as they are. Instead, reduce the height and increase the width of the required space. There is a good reason to do that. For one, you want to render a slight shadow for the font. This requires the output area to be slightly larger as the shadow will be offset to the right and the bottom of the image. Also, drop caps are always upper-case characters. The MeasureFont() method retrieves fundamental measurements of the passed character, and that includes under lengths as they occur in some lower-case letters, such as “g,” “y,” and the like, despite the fact that your chosen character does not have under lengths. (The height for every character in a certain font is always the same.) Because you are not interested in providing space for those under lengths, subtract 10 pixels from the returned values. (Note that this is a somewhat lazy approach. You could have also calculated the correct under length on the fly rather than hard-coding it.)
This is practically all the heavy lifting that is required. You can now generate a new Bitmap object based on the calculated dimensions, retrieve the true Graphics object for the rendering operations, and set the background of the Bitmap to whatever you want it to be (navy blue, in my example).
Then, you render the character centered into the new drawing canvas (Bitmap). To do so, you first have to provide a drawing rectangle (much like a textbox in Word), and you do this using a RectangleF object. This specifies the boundaries in which the text is to be rendered. The real significant step here is the generation of the StringFormat object, which allows you to instruct GDI+ where to draw the font. In this example, set both horizontal and vertical alignment to be centered. Then use that format object to draw the actual string that results in the desired placement of the drop cap. (Note that you are drawing two strings: one for the shadow and one for the actual character).
At this point you are ready to send the result to the client as a GIF file. This means that you have to set the content type of the output to “image/gif” and subsequently save the image to the output stream.
To add the drop cap to a page, add the following image tag:
<IMG src="DropCap.aspx?Letter=A"
align="left" border="0">
Note that the align=“left” attribute is very important, as it positions the image at the appropriate position within the current paragraph. Figure 1 shows this type of drop-cap in action on my personal Web site (www.MarkusEgger.com).
An interesting aspect of this code is that you do not limit the length of the displayed text to a single character. It would be perfectly fine to add the following code to your Web page:
<IMG src="DropCap.aspx?Letter=Hello"
align="left" border="0">
Although this is not particularly useful for drop cap generation, it may be very useful in other environments.
The drop cap technique also allows for more artistic approaches. Figure 2, for instance, is inspired by medieval texts. The generation of that drop cap is very similar to the previous example, except that the character is drawn onto an existing background image (see Part 1 of this article series for an explanation of that technique).
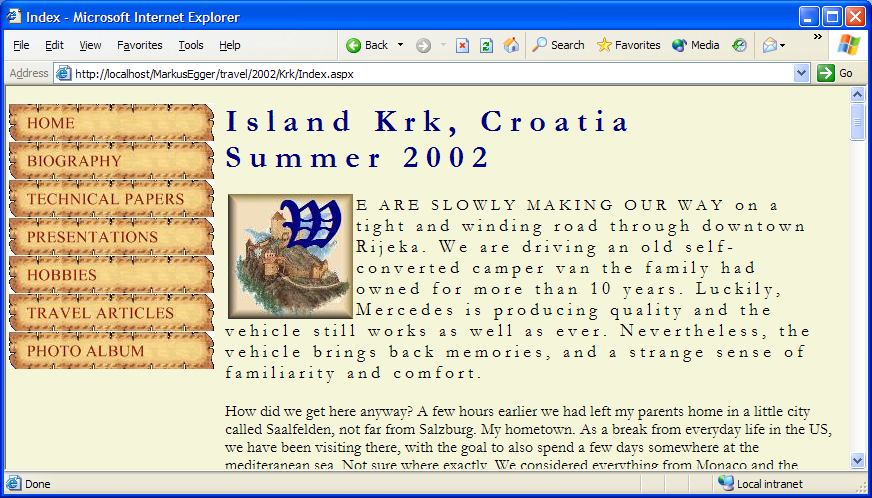
Note: The background image comes from a medieval clipart collection (http://members.easyspace.com/Brig/index.html).
Generating Graphs
Another rather interesting possibility is the creation of dynamic graphs. The basic idea behind creating a graph is much the same. The main difference is that you use low-level drawing operations to generate a simple bar graph (Figure 3).
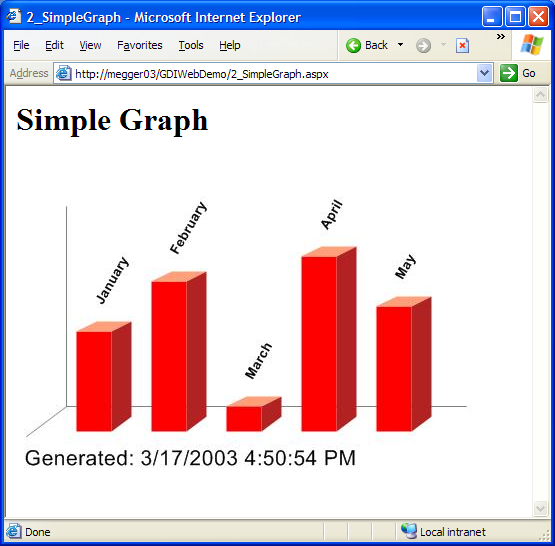
In this example (Listing 2), you once again create a blank in-memory Bitmap. You then use the DrawLine() method on the Graphics object to draw the “coordinate cross” as the background. That's the prep-work. Now you are ready for the exciting part: Drawing the actual bars.
In this implementation the values to be graphed are hard coded?in real-world implementations, you would query these values from a database. The actual drawing of the bars is done in the DrawBar() method, which is called with a reference to the Graphics object, the value, the bar number (which could also be calculated on the fly), and text that is to appear above the bar.
Each bar is composed of three different shapes: The front, the top, and the right side of the “box.” Drawing the front is almost trivial?after you calculate the height of the bar you can use the FillRectangle() method on the Graphics object. The top and the side are a little trickier, as their shape is more irregular. They are pretty easy to describe using GraphicsPath objects, which is especially true because Graphics paths automatically close themselves. In other words, you only have to draw every other line, and the object itself adds the missing pieces. For the four-sided polygon, you only have to draw two lines. Finally, use the FillPath() method to fill these two paths with the specified color.
There are a few extra little steps to take to make the graph look good. You can use different colors for each side to produce a more realistic lighting effect. Additionally, you can add a simple perspective effect to the actual shape. In other words, you can use fewer pixels for the rear edges of the bars than for the front edges. Of course, this is a pretty simple trick to enhance the look of the graph. It would be much nicer to calculate an actual vanishing point, but that would be beyond the scope of this article.
Another important element is that you need to manually calculate the offset of each bar so they are positioned from left to right. Do this when you define the path, because all information inside paths assumes absolute positioning. Another option is to define the path at a neutral position, and then transform the coordinate system to allow dynamic positioning. Either way works well for the current scenario.
The only remaining drawing operation is the display of the angled label over each bar. This requires performing a rotate transformation on the virtual coordinate system (see the sidebar “World Transformations” for more information). As described in the May/June 2003 issue of CoDe Magazine ("The Basics of GDI+"), positioning elements correctly after a rotate transformation can be challenging if the desired element is anywhere other than at position 0,0. Therefore, it is usually a good idea to first move the 0,0 point of the coordinate system to the desired point and then perform the rotation. Rendering the angled text thus becomes a simple call to the DrawString() method.
That's it! The graph is done, and you are ready to stream it back to the browser.
A Dynamic Diagram
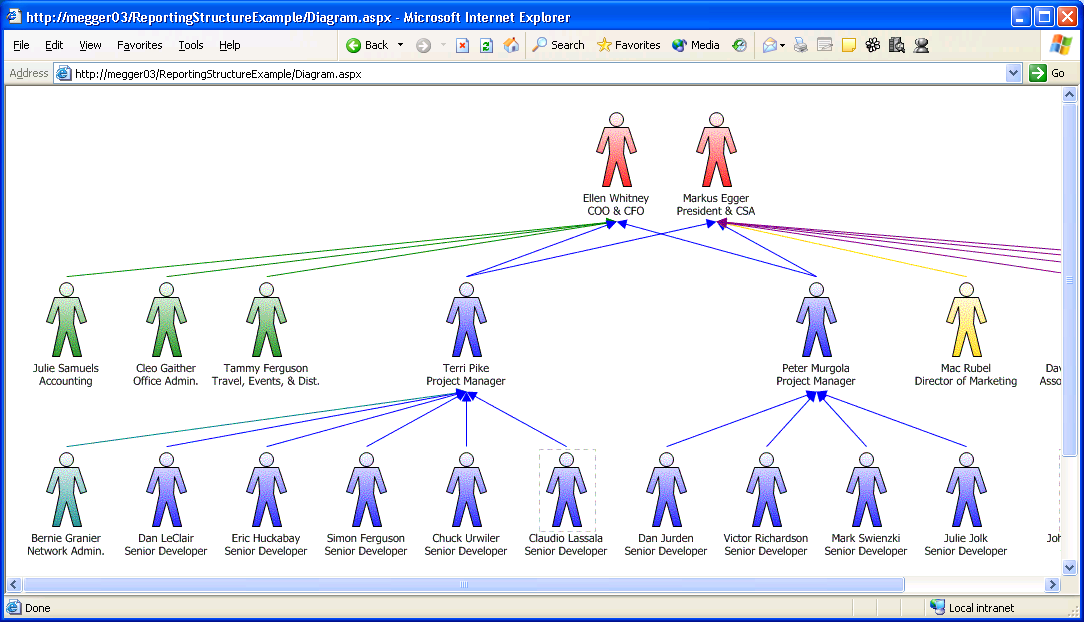
A somewhat similar task is rendering a dynamic diagram. In Part 1 I showed how to use a Graphics path to render the familiar shape of a human (well, a stick-figure). Using the basic technique described in that article, you can create a control that renders a human-relationship chart. In fact, a similar charting mechanism is common in many corporate HR departments.
Often, it is very helpful to show those types of charts dynamically (and to keep them up-to-date) on the Web. Listing 3 shows the implementation of such a diagram. Most of this code should already be familiar. After creating the drawing canvas, you generate a Graphics path that defines the shape of a person. The actual drawing of the person is handled by (you guessed it) the DrawPerson() method. This method is actually a bit more generic than its name suggests. It has the ability to draw any shape (Graphics path) onto any drawing surface at a defined position, as these are passed as parameters. Also, the method requires a fill color, as well as a label to be passed along.
The drawing code itself is quite simple. The method transforms the coordinate system to allow it to position the shape as desired. The trickiest part here is measuring the text dimensions to allow for the automated, centered position of the text below the shape. (For a more detailed explanation of font measurement code, see the drop cap sample discussed earlier in this article.) Another effect applied in this example is a gradient brush to fill the shape rather than using the plain color that is passed along. This makes the diagram look a lot more professional. The DrawPerson() method generates a new gradient brush that flows from white (at the top) to the color originally passed along (at the bottom).
In this example, you call the DrawPerson() method several times with a few hard-coded values. In real life, of course, a more dynamic approach is required.
Just positioning a number of shapes on a drawing canvas is not very informative. In order to display the relationships among the people on the diagram, you have to draw arrows among them. This is handled by the ConnectPerson() method. Fundamentally, this method draws a line of a certain color between two specified points. The only part of this code worth explaining in detail is the arrowhead. In GDI+, lines can have a number of different end-point styles including the arrowhead. The size of the arrowhead depends on the thickness of the line. Unfortunately, the size chosen for a one-pixel line is so small that it is hardly visible. For this reason, you have to create a custom line cap. For this particular need, GDI+ provides an adjustable arrowhead, which you instantiate at the desired size and attach to the line object you use to draw. (If you had a more sophisticated requirement, you could generate a line cap entirely from scratch as well.)
Figure 4 shows this rendering logic in action with a few more objects added.
Conclusion
I hope this series of articles has given you a few good ideas you can use in your own Web sites. Dynamic diagrams could be used for all kinds of things, from relationship diagrams to a read-only view of UML models. Graphs can show sales figures without the need for additional tools. The images manipulated in the first part of this article series could be used for thumbnails, dynamic banners, and much, much more. Let me know what other ideas you come up with!
Listing 1: Generating a simple drop cap
' Include System.Drawing.Imaging at the top

Private Sub Page_Load(ByVal sender As System.Object, _   ByVal e As System.EventArgs) Handles MyBase.Load
Dim objGraphics As Graphics
Dim intHeight As Integer
Dim intWidth As Integer

Dim strLetter As String = _      Request.QueryString("letter")

' First, you figure out how tall and wide
' the letter is
Dim objFont As New _      Font("Garamond", 36, FontStyle.Bold)

' Use a dummy Bitmap to get the functionality
' needed to measure
Dim bmpDummy As New Bitmap(100, 100)
objGraphics = Graphics.FromImage(bmpDummy)
Dim objSize As SizeF = _      objGraphics.MeasureString(strLetter, objFont)
intHeight = objSize.Height - 10
intWidth = objSize.Width + 2

' You are now ready to create the real Bitmap
Dim bmpLetter As New Bitmap(intWidth, intHeight)
objGraphics = Graphics.FromImage(bmpLetter)
objGraphics.TextRenderingHint = _      Drawing.Text.TextRenderingHint.AntiAlias

' You are now ready to draw the string into
' your box...
objGraphics.Clear(Color.Navy)
Dim objRect As New _      RectangleF(0, 3, intWidth, intHeight)
Dim objRect2 As New _      RectangleF(2, 5, intWidth, intHeight)
Dim objSF As New StringFormat()
objSF.Alignment = StringAlignment.Center
objSF.LineAlignment = StringAlignment.Center
objGraphics.DrawString(strLetter, objFont, _      Brushes.Gray, objRect2, objSF)
objGraphics.DrawString(strLetter, objFont, _      Brushes.White, objRect, objSF)

' You send the Bitmap to the browser
Response.ContentType = "image/gif"
bmpLetter.Save(Response.OutputStream, _      ImageFormat.Gif)

' You clean up
bmpLetter.Dispose()
bmpDummy.Dispose()
objGraphics.Dispose()
objFont.Dispose()
objSF.Dispose()
End Sub
Listing 2: Generating a simple bar chart
using System;
using System.Collections;
using System.ComponentModel;
using System.Data;
using System.Drawing;
using System.Drawing.Drawing2D;
using System.Drawing.Imaging;
using System.Drawing.Text;
using System.Web;
using System.Web.SessionState;
using System.Web.UI;
using System.Web.UI.WebControls;
using System.Web.UI.HtmlControls;

namespace GDIWebDemo
{
public class _2x_SimpleGraphImage :       System.Web.UI.Page
{
private void Page_Load(object sender,          System.EventArgs e)
{
// You need a drawing surface
Bitmap bmpCanvas = new Bitmap(500,320);

// You need to generate a Graphics object          // from that drawing surface, so you can draw
Graphics objGraphics =
Graphics.FromImage(bmpCanvas);

// Make sure you do not have          // smoothing problems
objGraphics.SmoothingMode =             SmoothingMode.HighQuality;
objGraphics.TextRenderingHint =             TextRenderingHint.AntiAlias;

// You want a white background for the image
objGraphics.Clear(Color.White);

// Draw the graph background...
objGraphics.DrawLine(Pens.Gray,50,250,50,50);
objGraphics.DrawLine(Pens.Gray,
50,250,450,250);
objGraphics.DrawLine(Pens.Gray,50,250,10,280);

// Establish five sample values.
// This could come out of a database.
int Val1 = 4; int Val2 = 6; int Val3 = 1;
int Val4 = 7; int Val5 = 5;

// Now draw the bar for each value
this.DrawBar(objGraphics,Val1,0,"January");
this.DrawBar(objGraphics,Val2,1,"February");
this.DrawBar(objGraphics,Val3,2,"March");
this.DrawBar(objGraphics,Val4,3,"April");
this.DrawBar(objGraphics,Val5,4,"May");

// Just so you see this is dynamic...
objGraphics.DrawString(            "Generated: "+DateTime.Now.ToString(),
new Font("Arial",16),Brushes.Black,5,290);

// You now define that this page is an image,
// not an HTML page, and stream the image
// back to the client
Response.ContentType = "image/jpeg";
bmpCanvas.Save(Response.OutputStream,
ImageFormat.Jpeg);

// All done. You can cancel further
// processing and clean up the environment
bmpCanvas.Dispose();
objGraphics.Dispose();
Response.End();
}

private void DrawBar(Graphics objGraphics,
int Value, int BarNumber, string Label)
{
// Draw bar charts, and for simplicity
// assume a maximum value of 10.
int intLeft   = (BarNumber*75)+60;
int intBottom   = 275;
int intHeight   = (25*Value);

// You are ready to draw.

// Create a pen for later use...
// Pen penOutline = Pens.DarkRed;

// Front
objGraphics.FillRectangle(            Brushes.Red,intLeft,            intBottom-intHeight,35,intHeight);

// Top
GraphicsPath pthTop = new GraphicsPath();
pthTop.AddLine(intLeft-1,            intBottom-intHeight,intLeft+20,            intBottom-intHeight-10);
pthTop.AddLine(intLeft+55,intBottom-
intHeight-10,intLeft+35,
intBottom-intHeight);
objGraphics.FillPath(Brushes.LightSalmon,
pthTop);

// Right side
GraphicsPath pthRight = new GraphicsPath();
pthRight.AddLine(intLeft+35,intBottom-
intHeight,intLeft+55,intBottom-
intHeight-10);
pthRight.AddLine(intLeft+55,
intBottom-15,intLeft+35,intBottom);
objGraphics.FillPath(Brushes.Firebrick,
pthRight);

// Finally, render the label
objGraphics.TranslateTransform(intLeft+15,            intBottom-intHeight - 30);
objGraphics.RotateTransform(300);
objGraphics.DrawString(Label,new
Font("Arial",10,FontStyle.Bold),
Brushes.Black,0,0);
objGraphics.ResetTransform();
}

#region Web Form Designer generated code
// Form designer code removed
}
}
Listing 3: Rendering an HR diagram.
using System;
using System.Collections;
using System.ComponentModel;
using System.Data;
using System.Drawing;
using System.Drawing.Drawing2D;
using System.Drawing.Imaging;
using System.Web;
using System.Web.SessionState;
using System.Web.UI;
using System.Web.UI.WebControls;
using System.Web.UI.HtmlControls;

namespace SimpleDiagram
{
public class Diagram : System.Web.UI.Page
{
private void Page_Load(object sender,          System.EventArgs e)
{
// Generate the drawing canvas
Bitmap bmpDiagram = new Bitmap(500,400);
Graphics g = Graphics.FromImage(bmpDiagram);
g.Clear(Color.White);
g.SmoothingMode = SmoothingMode.HighQuality;

// Ggenerate the shape of a person
GraphicsPath Person = new GraphicsPath();
Person.AddEllipse(23,1,14,14);
Person.AddLine(18,16,42,16);
Person.AddLine(50,40,44,42);
Person.AddLine(38,25,37,42);
Person.AddLine(45,75,37,75);
Person.AddLine(30,50,23,75);
Person.AddLine(16,75,23,42);
Person.AddLine(22,25,16,42);
Person.AddLine(10,40,18,16);

// Draw a few people
this.DrawPerson(g,Person,Color.Red,            200,10,"Boss");
this.DrawPerson(g,Person,Color.Blue,
50,170,"Worker 1");
this.ConnectPerson(g,80,160,230,110,
Color.Blue);
this.DrawPerson(g,Person,Color.Blue,
150,170,"Worker 2");
this.ConnectPerson(g,180,160,230,110,
Color.Blue);
this.DrawPerson(g,Person,Color.Green,
250,170,"Worker 3");
this.ConnectPerson(g,280,160,230,110,
Color.Green);
this.DrawPerson(g,Person,Color.Green,
350,170,"Worker 4");
this.ConnectPerson(g,380,160,230,110,
Color.Green);

// Save the completed diagram into
// the output stream
Response.ContentType = "image/jpeg";
bmpDiagram.Save(Response.OutputStream,            ImageFormat.Jpeg);
Response.End();
}

private void DrawPerson(Graphics graphics,
GraphicsPath Shape, Color fill, float x,
float y, string Name)
{
// Position the shape
graphics.TranslateTransform(x,y);

// Draw the person and fill it
// with a gradient
System.Drawing.Brush oBrush =
new LinearGradientBrush(
new Rectangle(0,0,60,90),
Color.White,fill,90,true);
graphics.FillPath(oBrush,Shape);
graphics.DrawPath(Pens.Black,Shape);

// Draw the name
StringFormat sf = new StringFormat();
sf.Alignment = StringAlignment.Center;
Font oFont = new Font("Tahoma",8);
System.Drawing.SizeF size =
graphics.MeasureString(Name,oFont);
System.Drawing.RectangleF rect =
new RectangleF(30-(size.Width/2),
80,size.Width,size.Height);
graphics.DrawString(Name,oFont,
Brushes.Black,rect,sf);

// Rset the coordinate shift
graphics.ResetTransform();
}

public void ConnectPerson(Graphics g, float x1,
float y1, float x2, float y2, Color lineColor)
{
// Draw a line with a custom arrow-head
Pen p = new Pen(lineColor,1);
CustomLineCap myCap =
new AdjustableArrowCap(5,5,true);
p.EndCap = LineCap.Custom;
p.CustomEndCap = myCap;
g.DrawLine(p,x1,y1,x2,y2);
}

#region Web Form Designer generated code
// Form designer code removed
}
}